How to Use ChartLab: A Complete Step-by-Step Guide
Welcome to ChartLab! Whether you're new to systematic trading research or looking to upgrade from static screenshots, this comprehensive guide will walk you through every feature ChartLab offers. By the end, you'll know how to build your own dynamic model book of trading setups that evolves with your analysis.
ChartLab transforms the way traders research and document chart patterns by combining the power of TradingView's charting capabilities with a comprehensive cataloging system. Let's dive into how to make the most of every feature.
Getting Started: Your ChartLab Dashboard
Once you've created your account and signed in, you'll land on your Dashboard. This is your command center for managing setup types, tags, and reviewing your saved setups. From here, you can easily access all of ChartLab's core features. Let's start by exploring how to build the foundation of your trading research system.
Define Your Patterns with Setup Types
Your first step is to define the trading patterns you want to track. From the Dashboard, open the Catalog and then navigate to the Setup Types section. If you're just starting, this page will be empty, ready for you to populate with your unique strategies.
Your Empty Canvas
When you first arrive, you'll see an empty setup types page - this is your blank canvas, ready to be filled with the patterns that define your trading strategy.
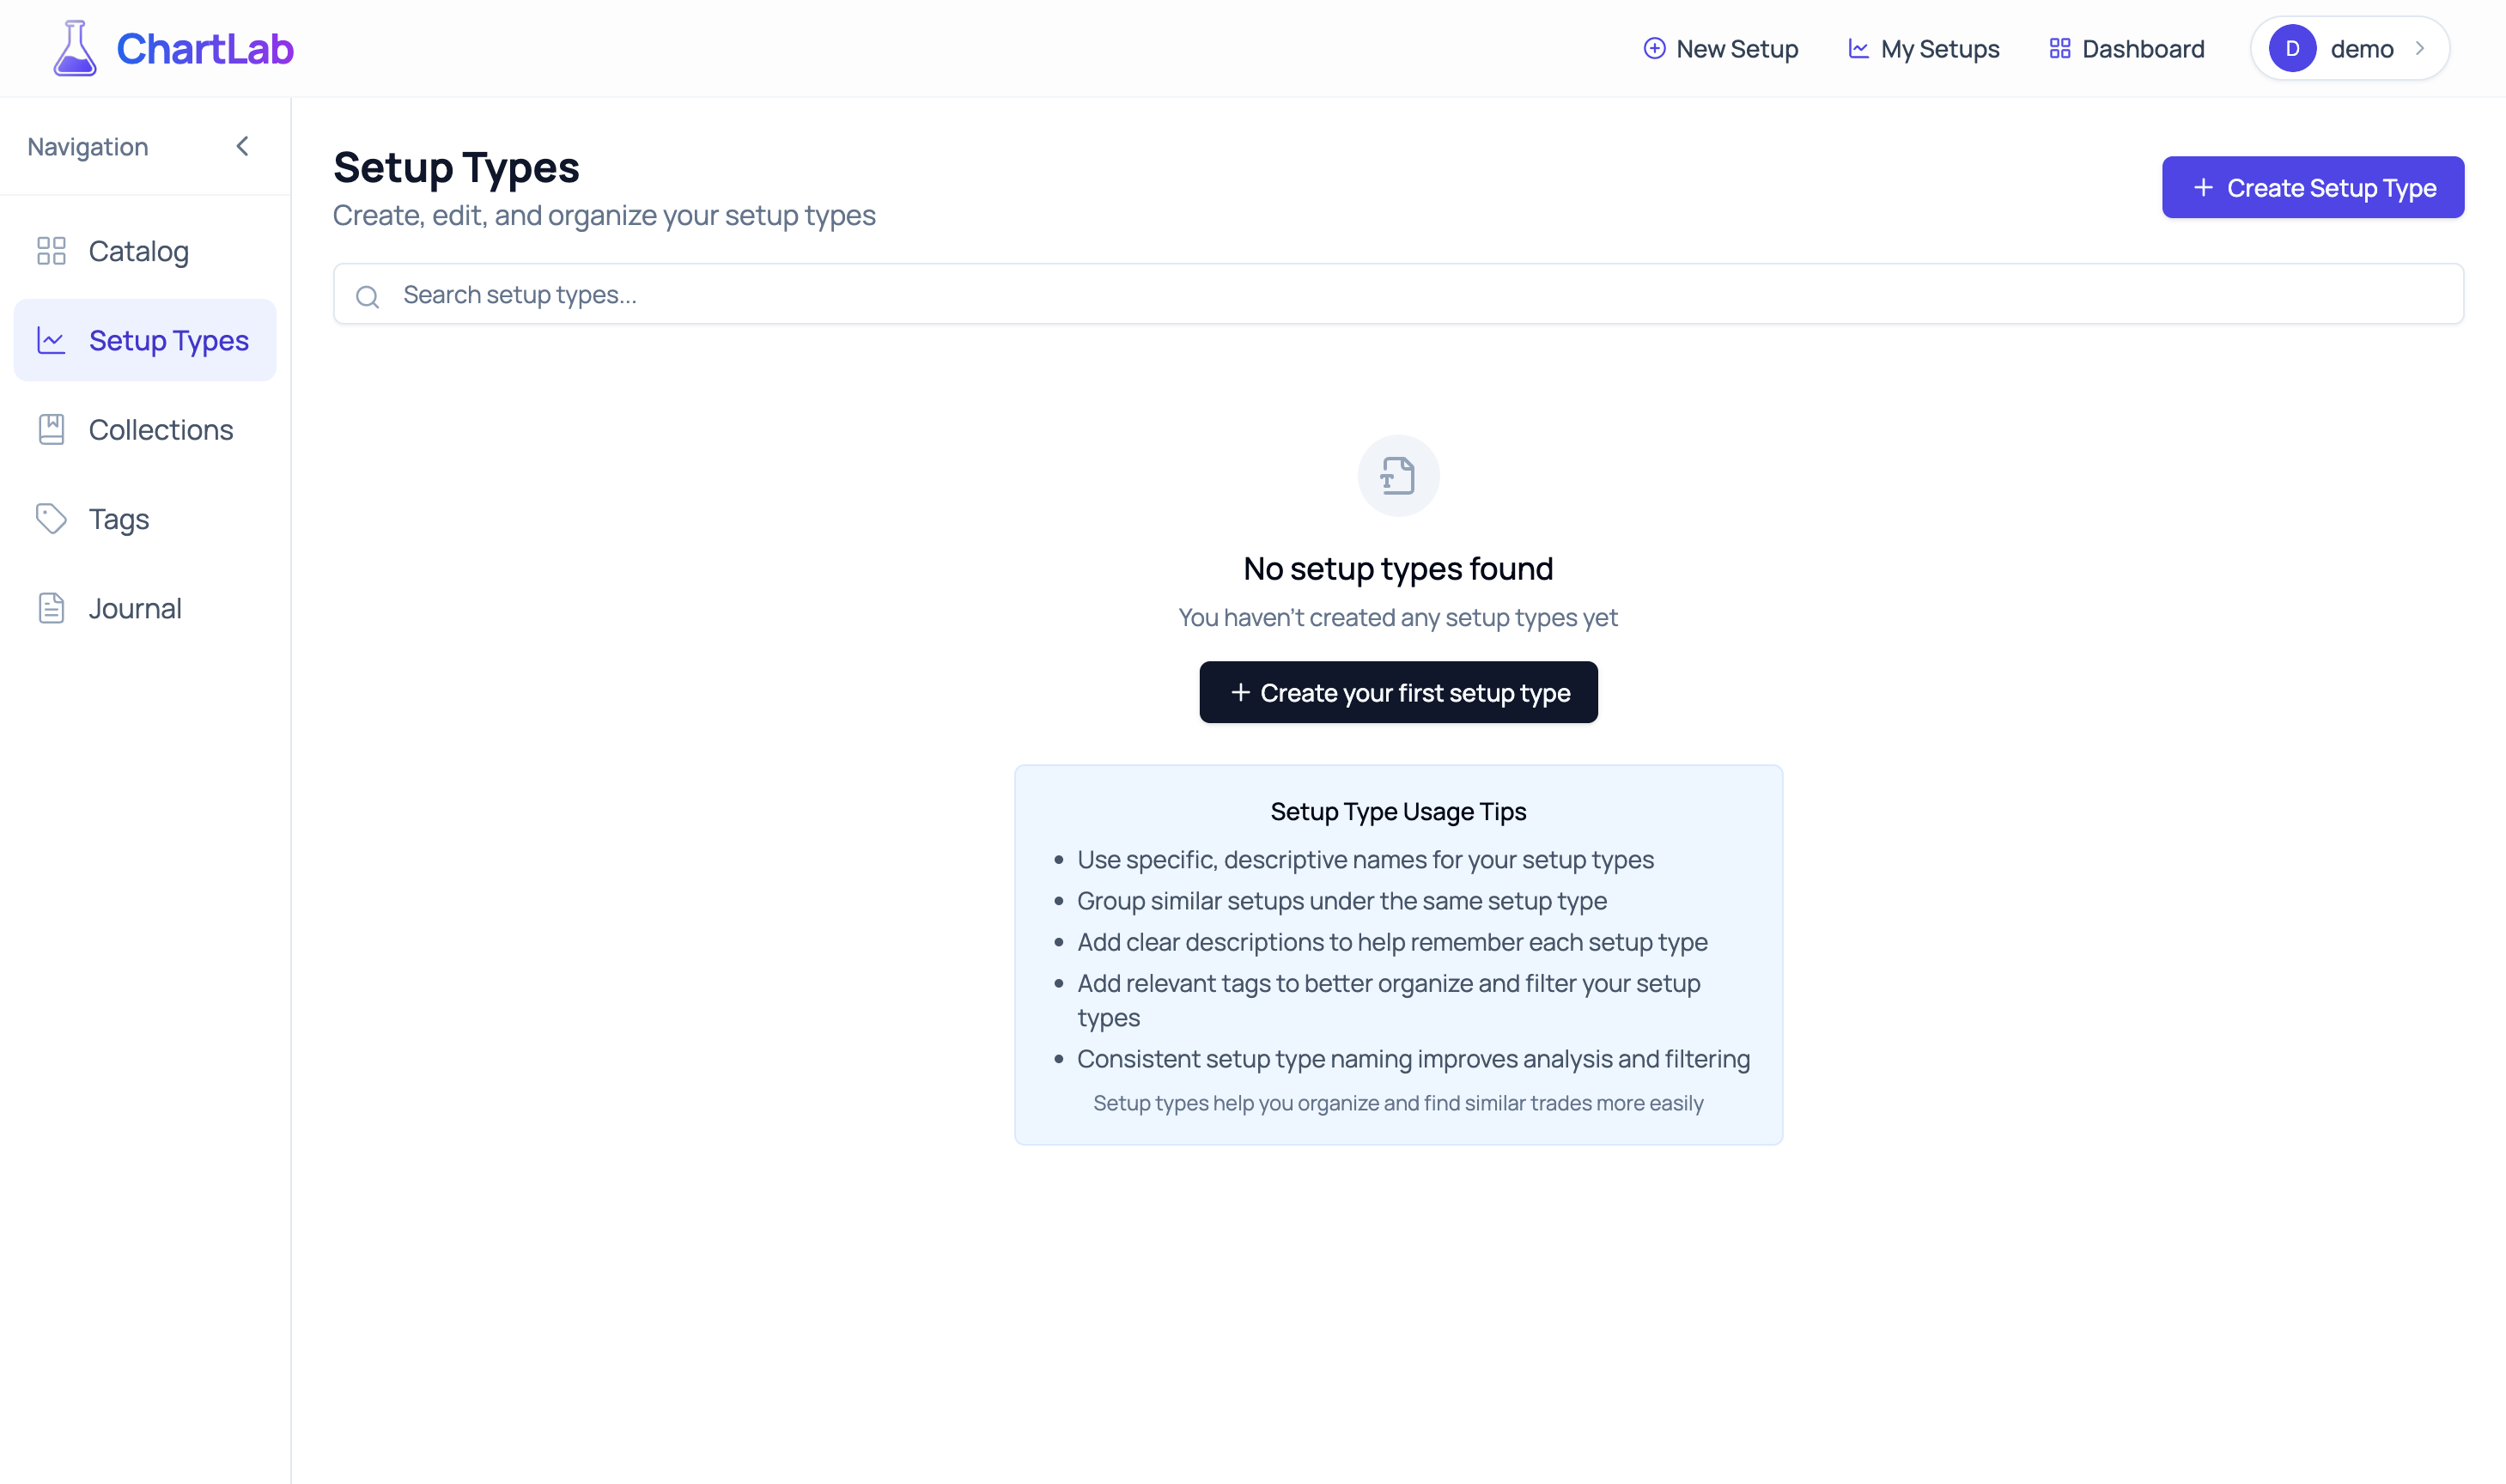
Empty Setup Types Page - Where your trading system begins
Setup types represent the specific strategies, trading styles, or chart patterns you want to track systematically. Each setup type represents a specific pattern or strategy you've identified and want to track systematically. Whether you're a breakout trader, a mean reversion specialist, or someone who trades multiple strategies, setup types give structure to your analysis.
Create Your First Setup Type - Define Your Edge
Ready to define your first pattern? Click the "Create Setup Type" button in the top right corner. This opens a dialog where you'll capture the essence of your trading pattern.
The Creation Process
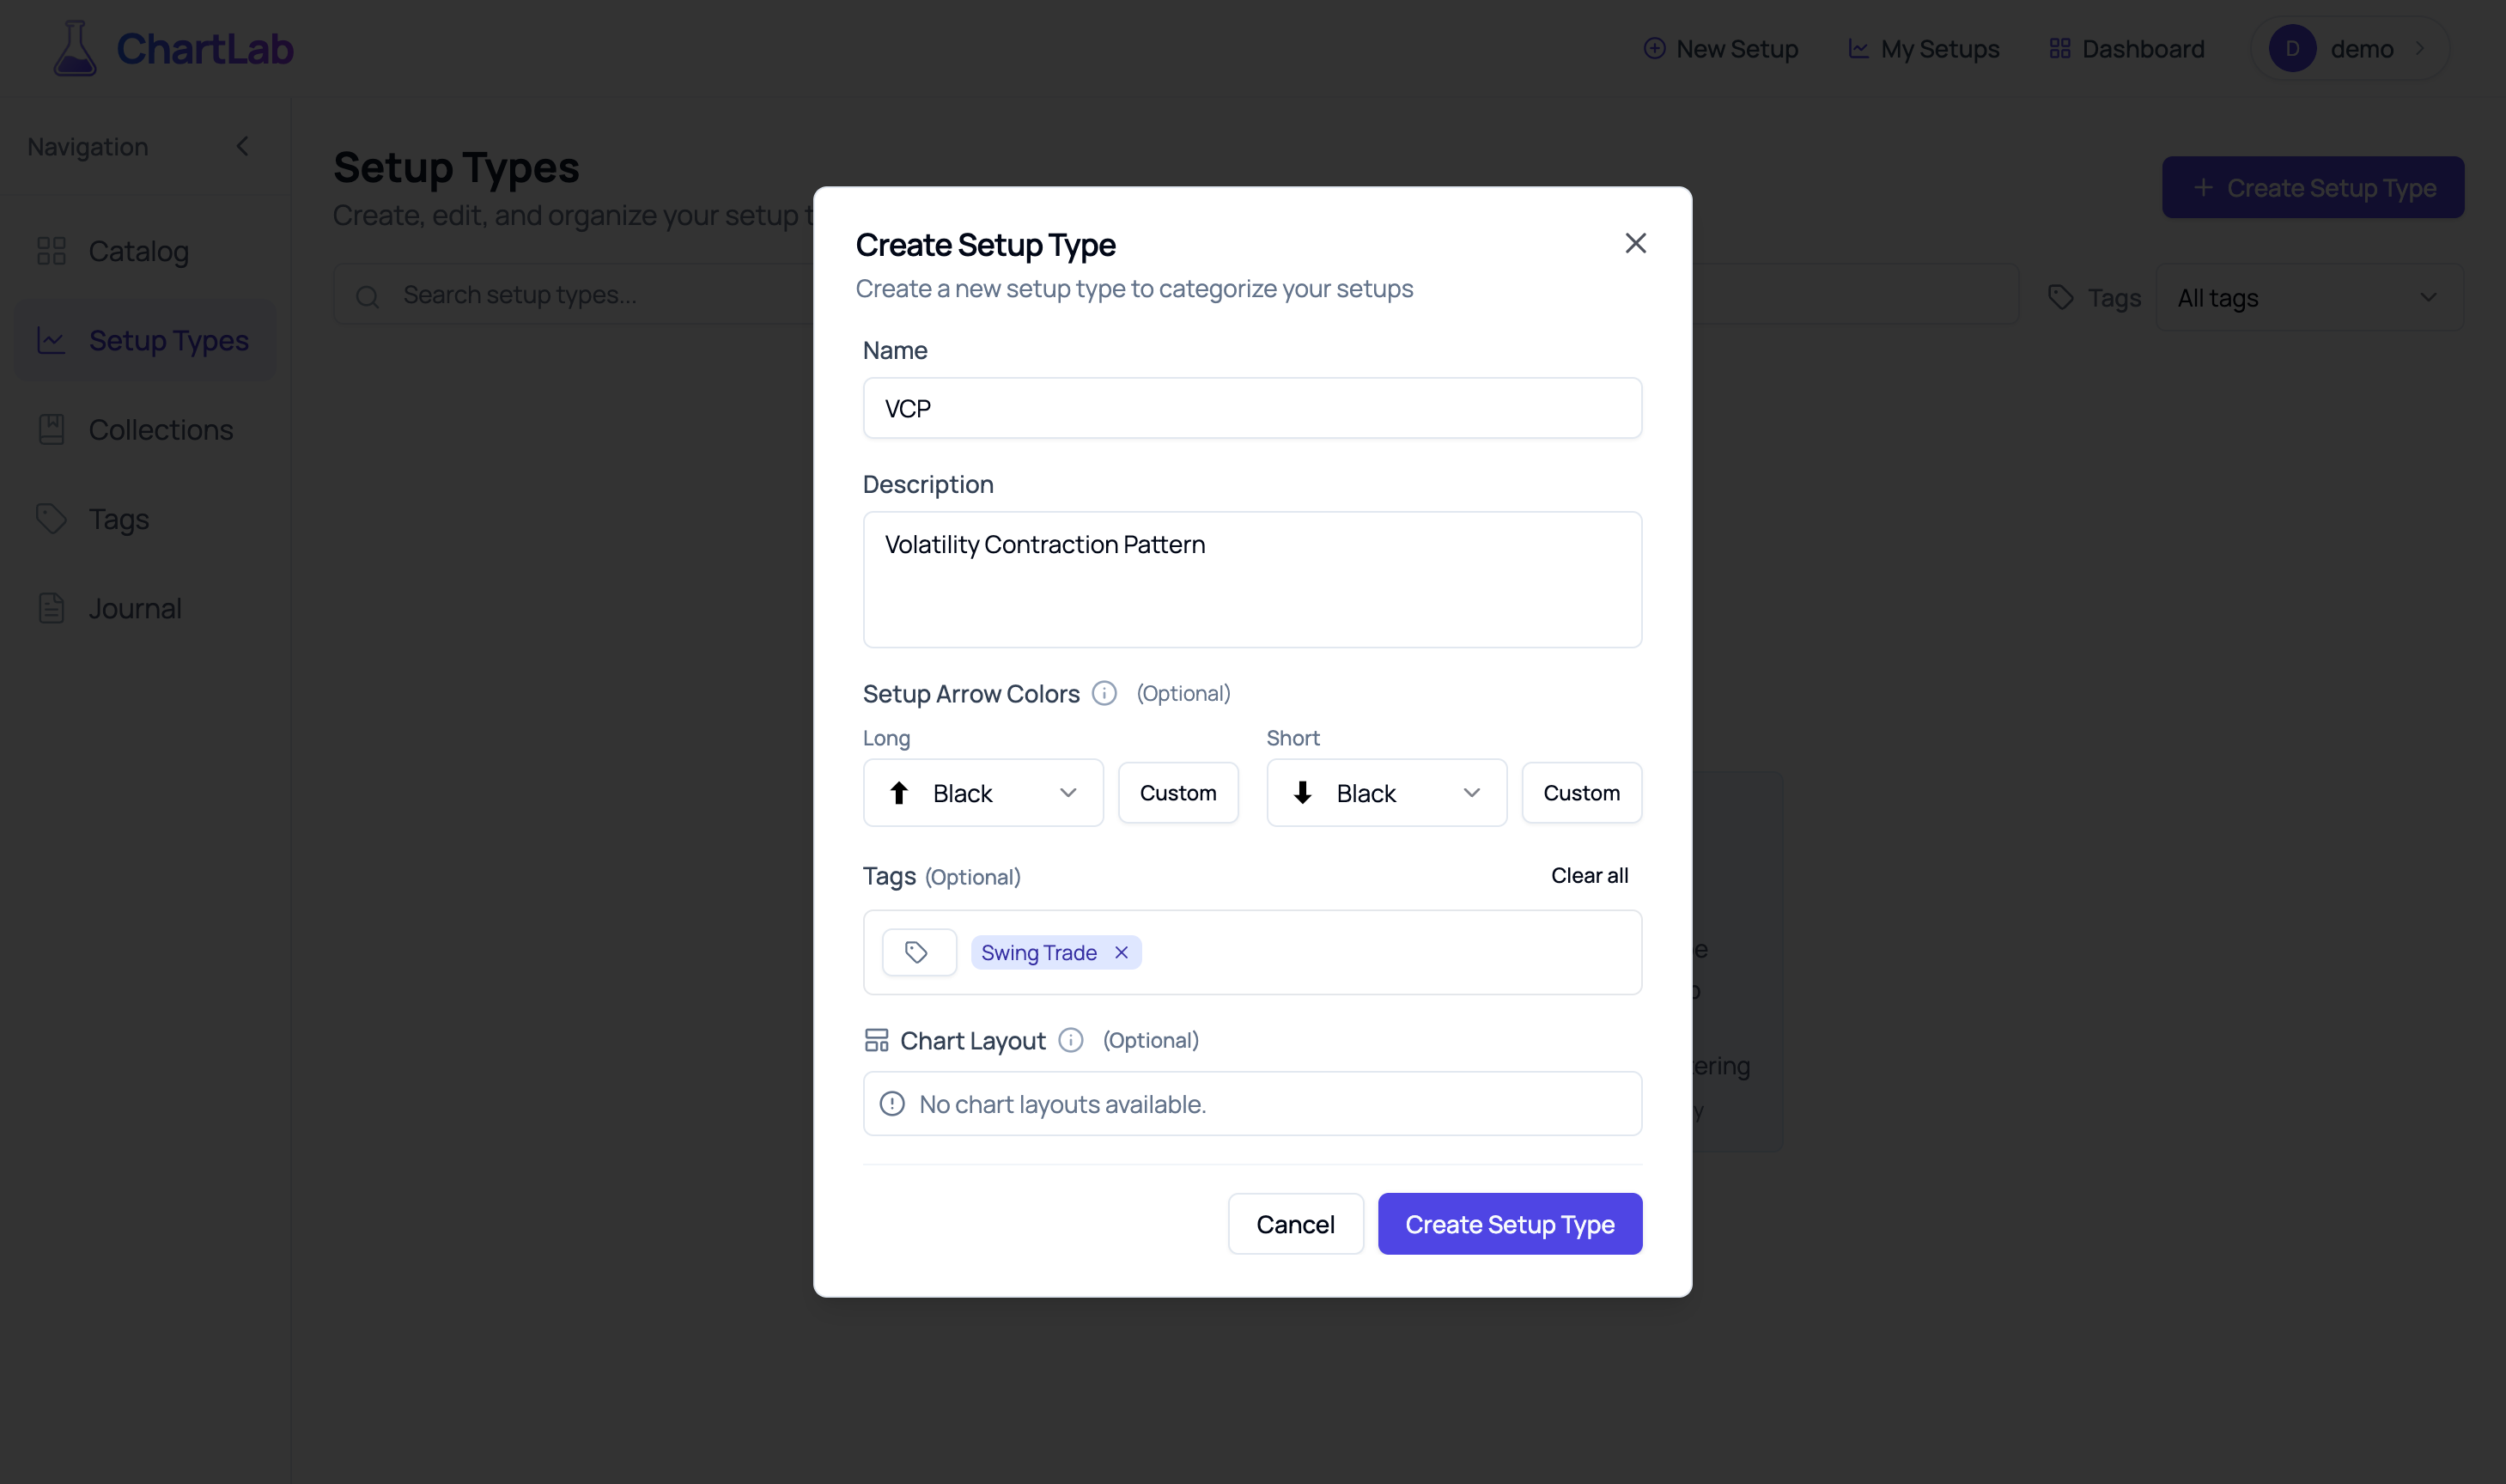
Create Setup Type Dialog - Define your pattern's characteristics
When creating a setup type, you're building more than just a label - you're creating a complete framework for analyzing this pattern:
- Name: Choose something clear and memorable (e.g., "Base Breakout", "VCP", "Cup & Handle")
- Description: Document the key characteristics that define this pattern - this helps maintain consistency as you document more setups
- Arrow Colors: Customize the visual indicators for long and short positions - these arrows will appear on your charts to mark entry points
- Tags: Apply organizational tags to group related setup types
Adding Tags for Enhanced Organization
One of ChartLab's most powerful features is the ability to tag your setup types. During creation, you can select from existing tags or create new ones on the fly.
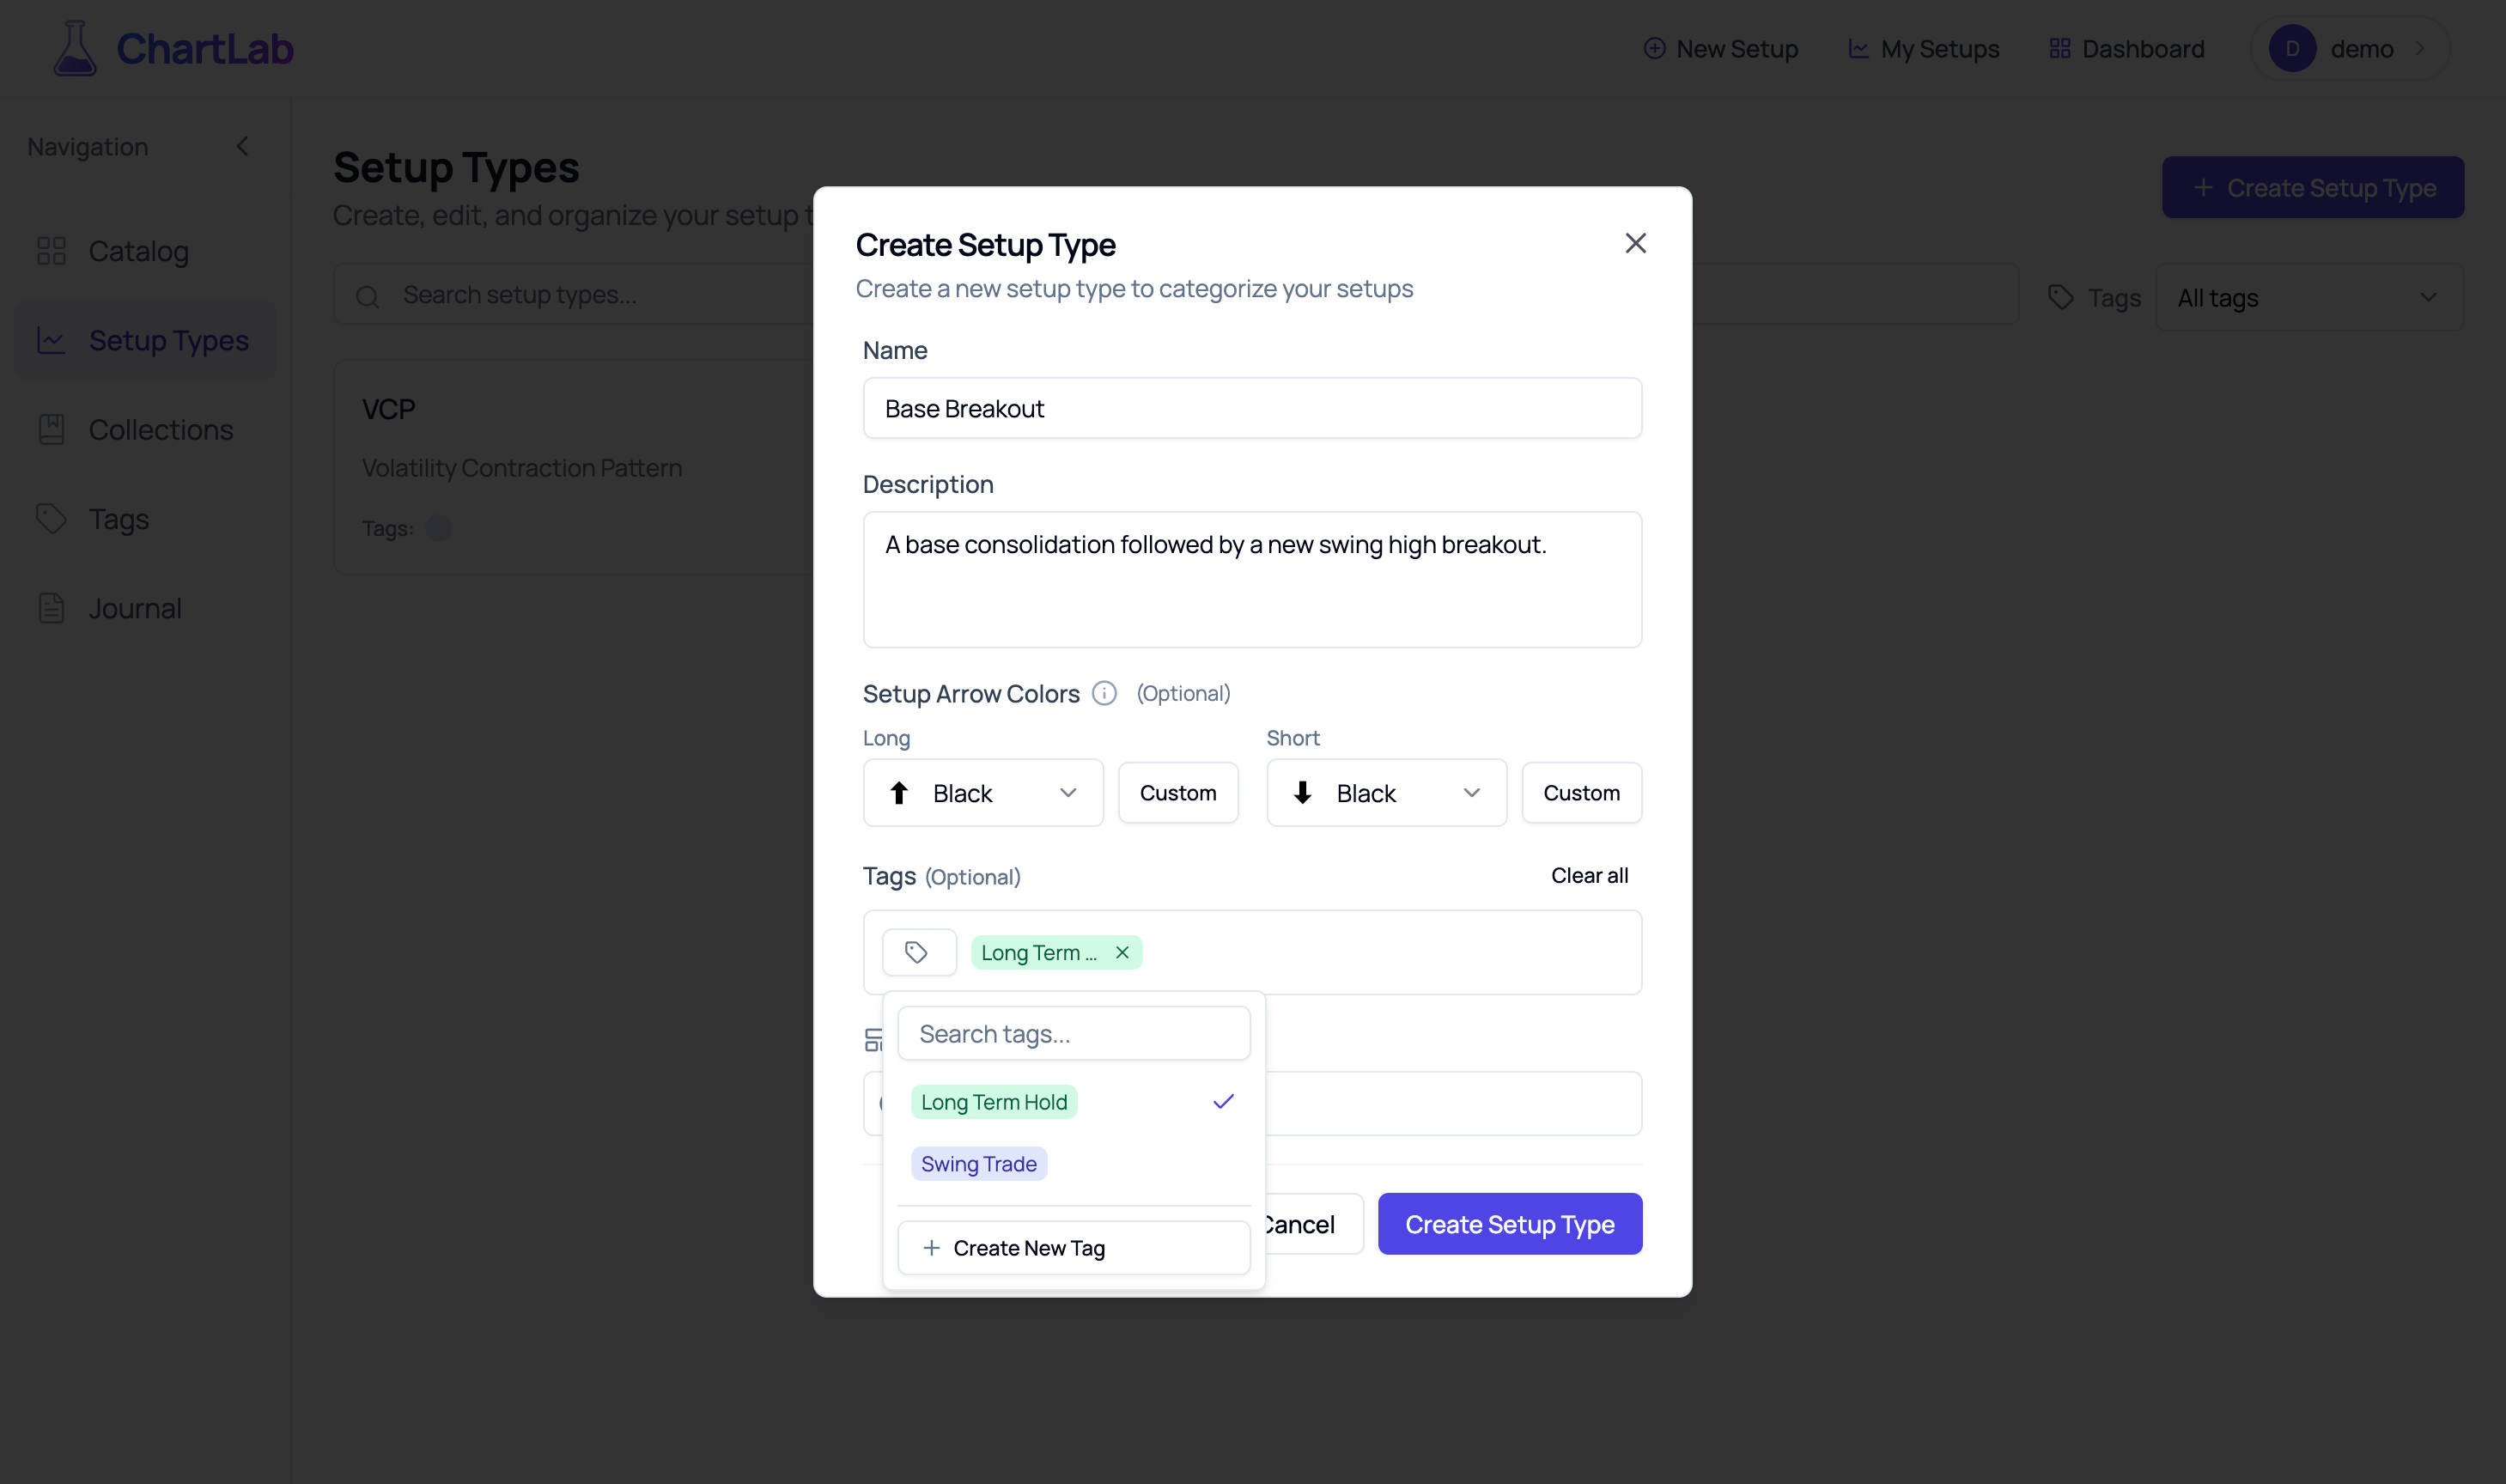
Creating Tags Within Setup Type Dialog - Seamless organization
Your First Setup Type is Live
Once you click "Create Setup Type", you'll see your first pattern appear in the dashboard. This is the beginning of your systematic approach to trading.
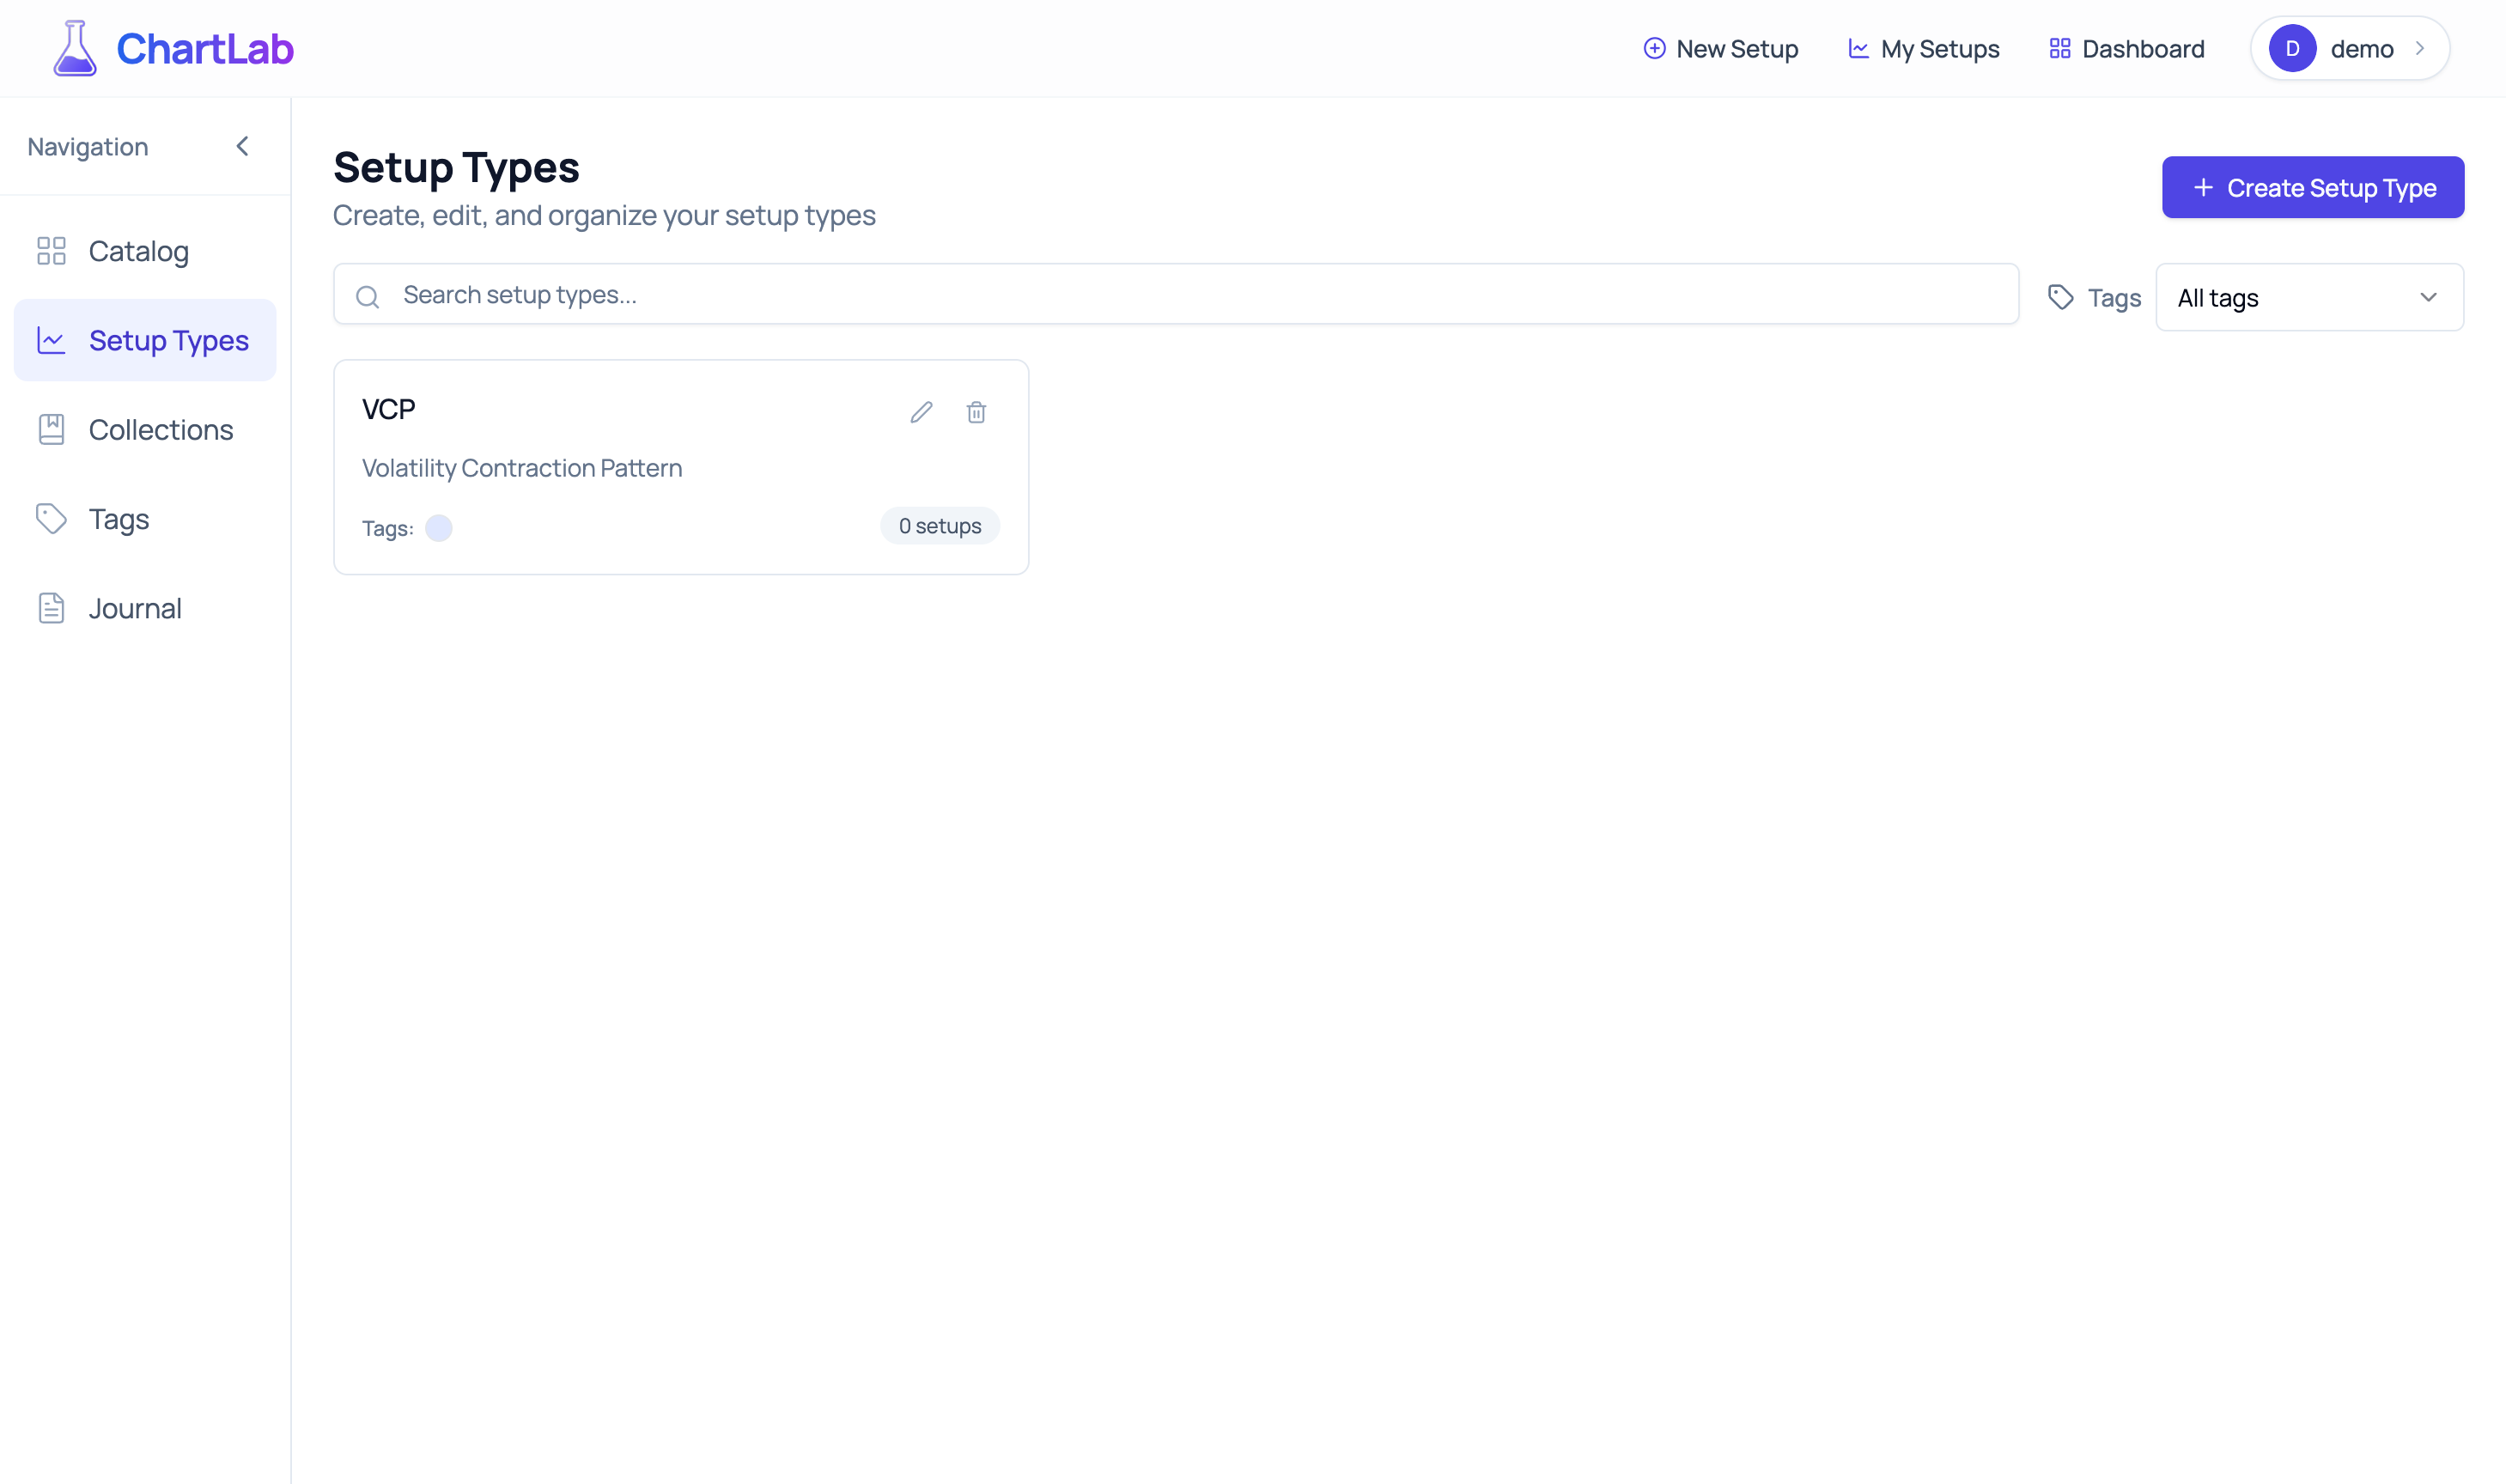
First Setup Type Created - Your pattern library begins
Building Your Complete Trading System
As you identify more patterns in your trading, continue adding setup types. Each one becomes a building block in your comprehensive trading system.
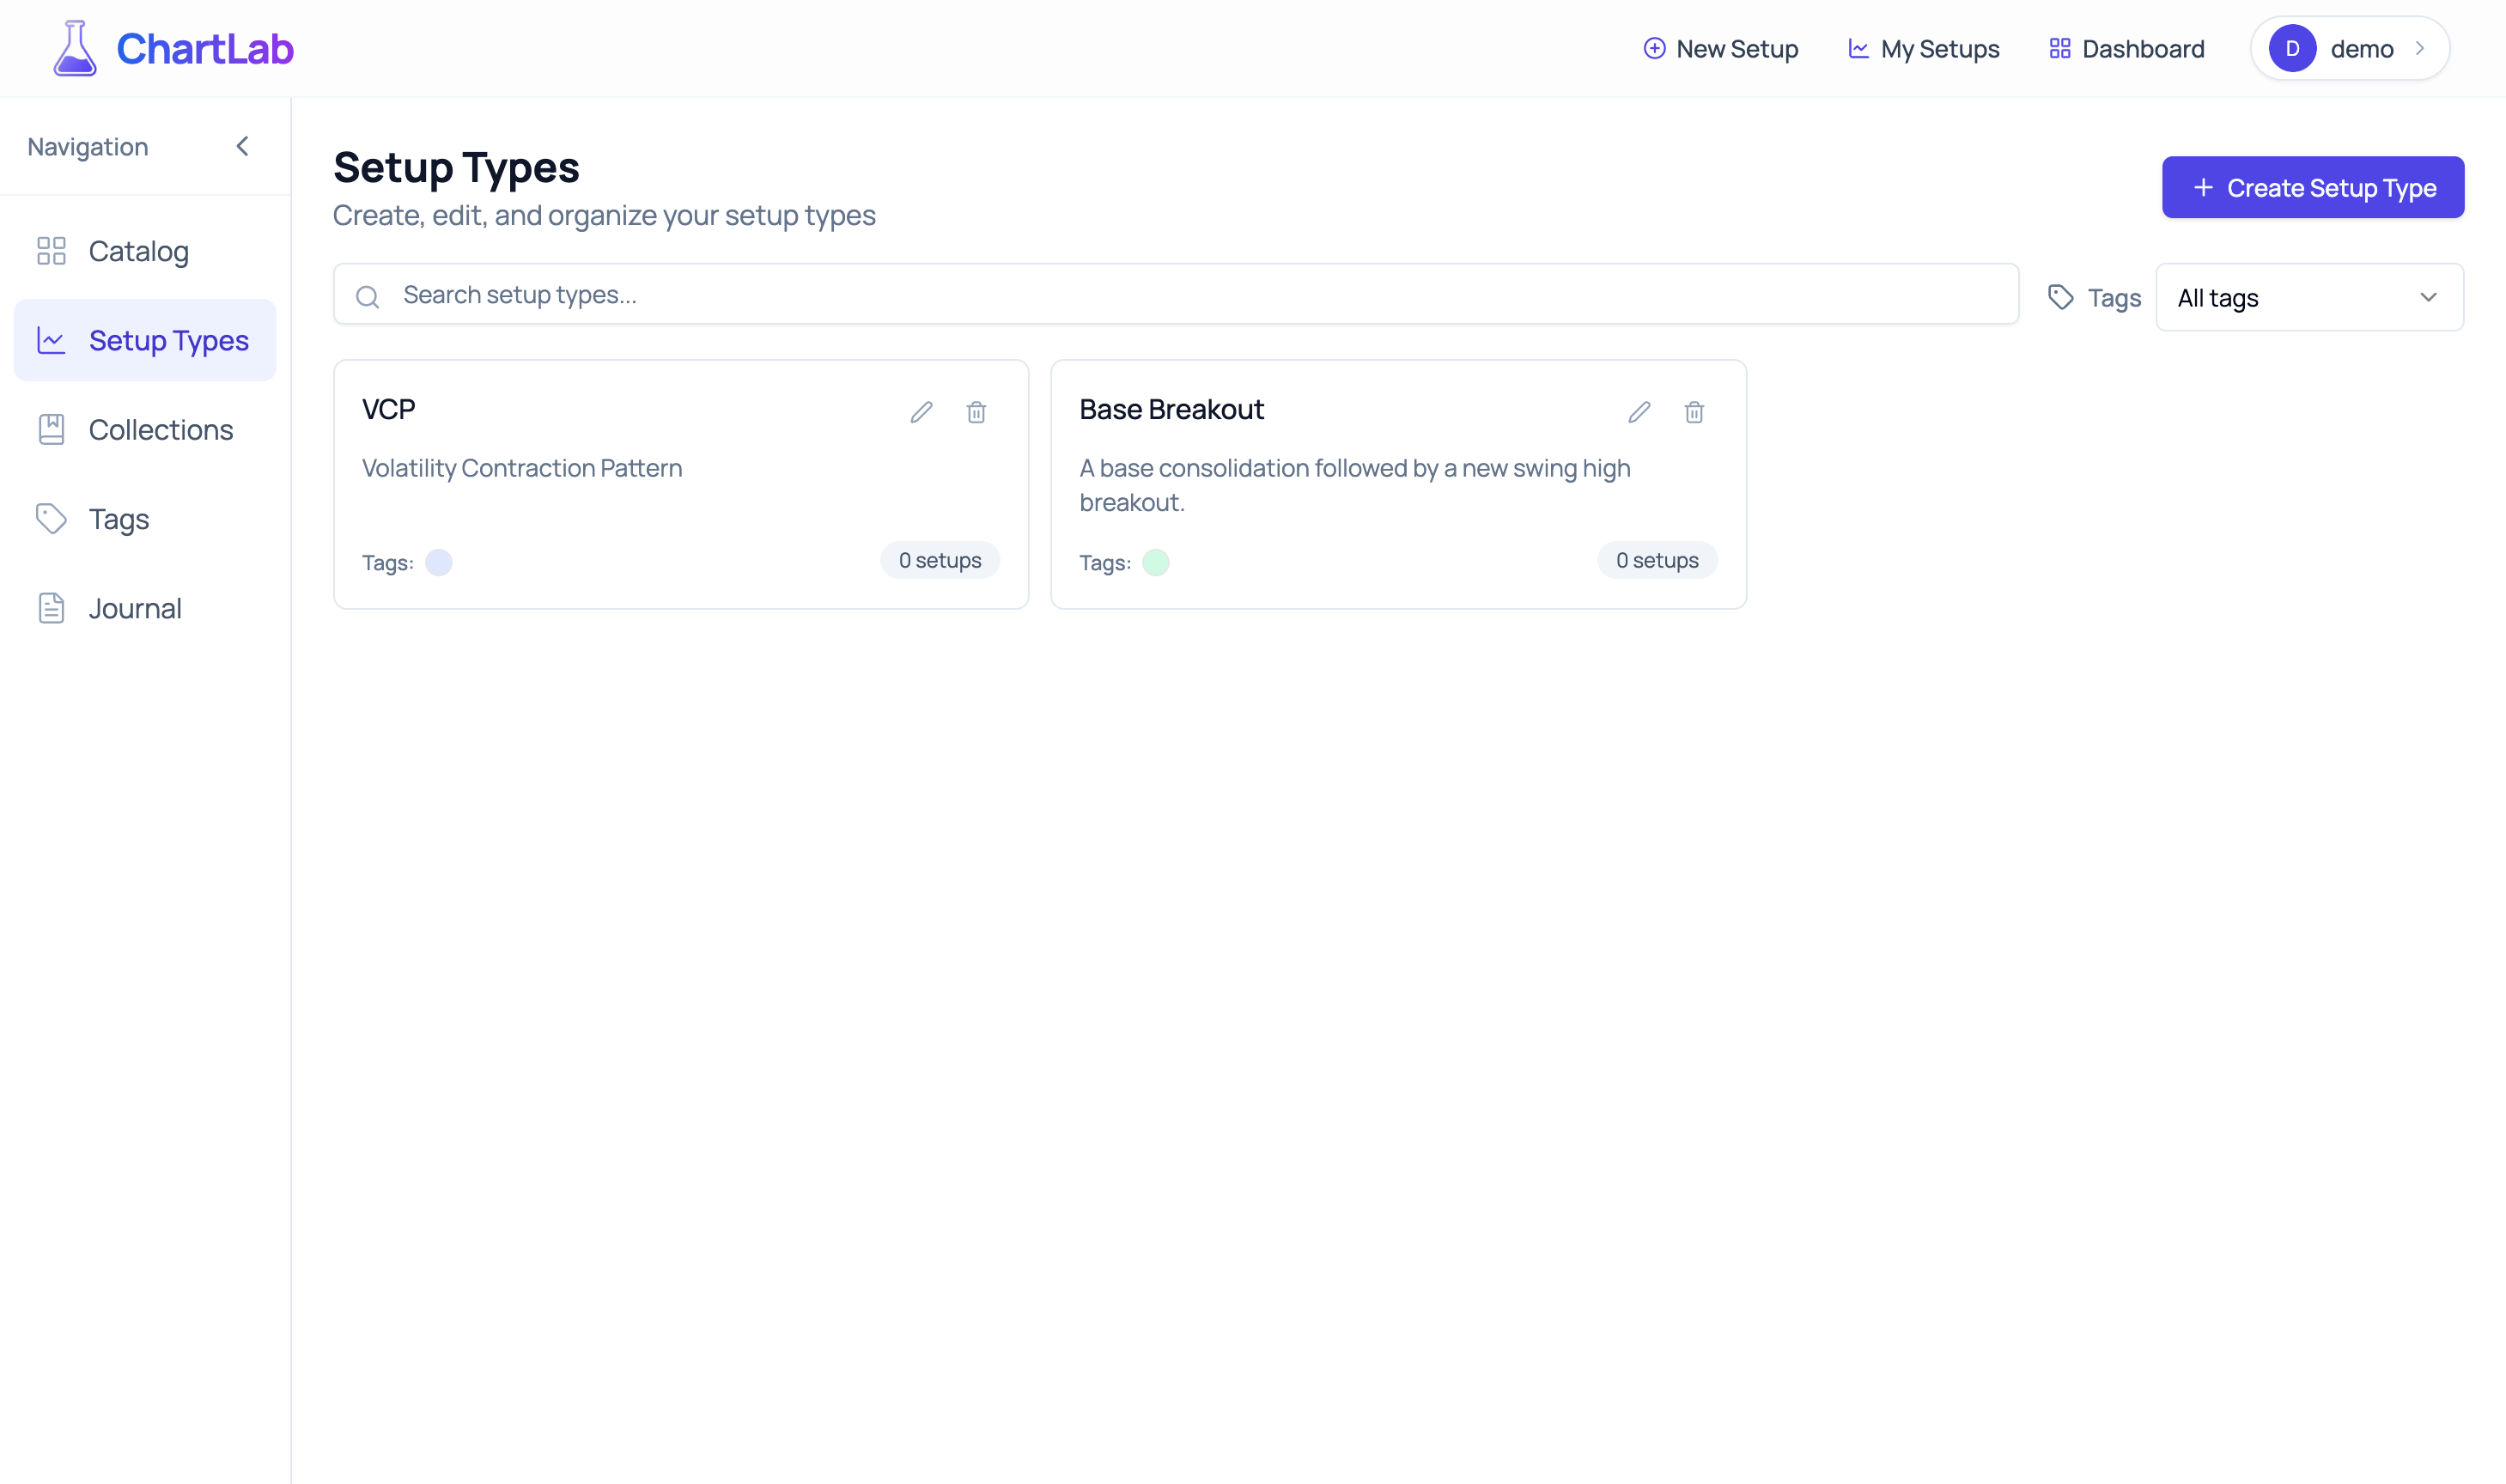
Multiple Setup Types Added - A growing pattern library
The Power of Chart Layouts
Here's where ChartLab truly shines. Each setup type can have an associated chart layout - a pre-configured set of indicators, drawing tools, and chart settings that automatically load when you're documenting that pattern.
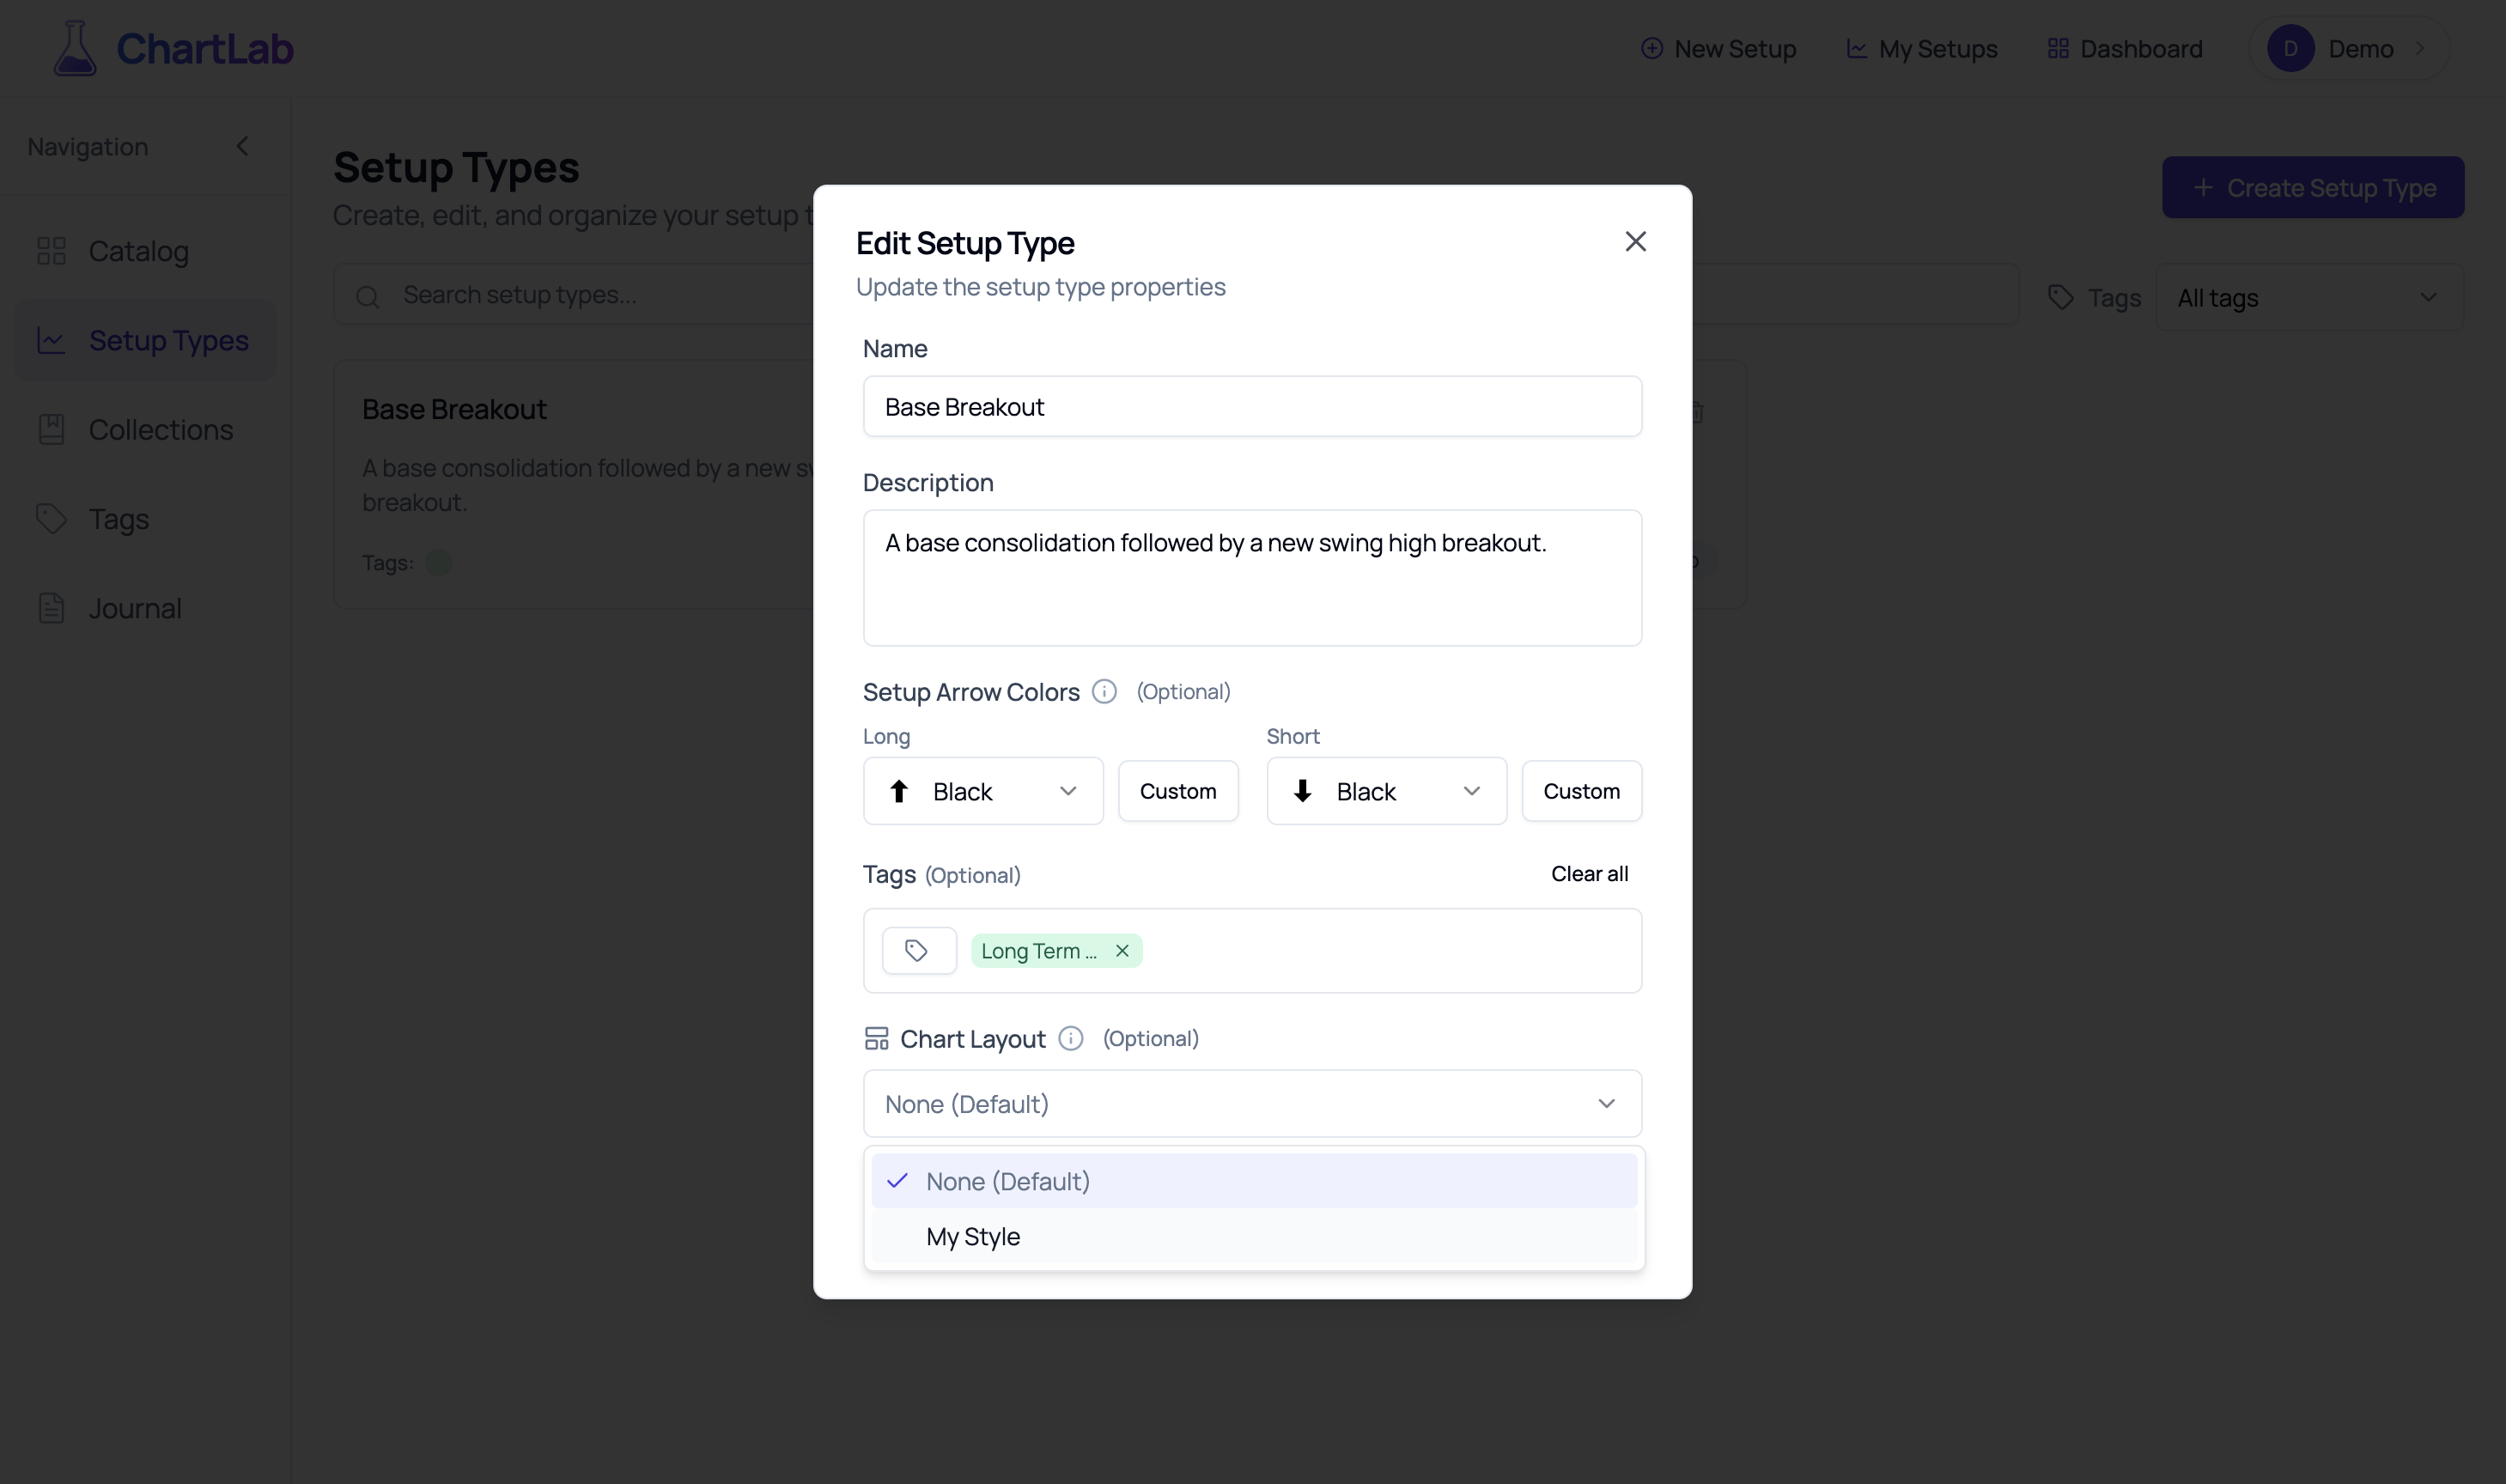
Edit Setup Type with Chart Layout - Consistency in analysis
By associating chart layouts with setup types, you ensure:
- Consistency: Every time you analyze this pattern, you're using the same indicators and settings
- Speed: No need to manually add indicators each time - they load automatically
- Evolution: As you refine your analysis approach, update the chart layout and all future setups benefit
Pro Tip: Start with 3-5 core setup types that represent your primary trading strategies. You can always add more as you refine your approach, but starting focused helps you build quality over quantity.
Create Your Tagging System
Next, from your Catalog, navigate to the Tags section. Tags provide a flexible way to mark setups with any characteristic you find important - market conditions, success rates, specific sectors, or any other criteria that matters to your analysis.
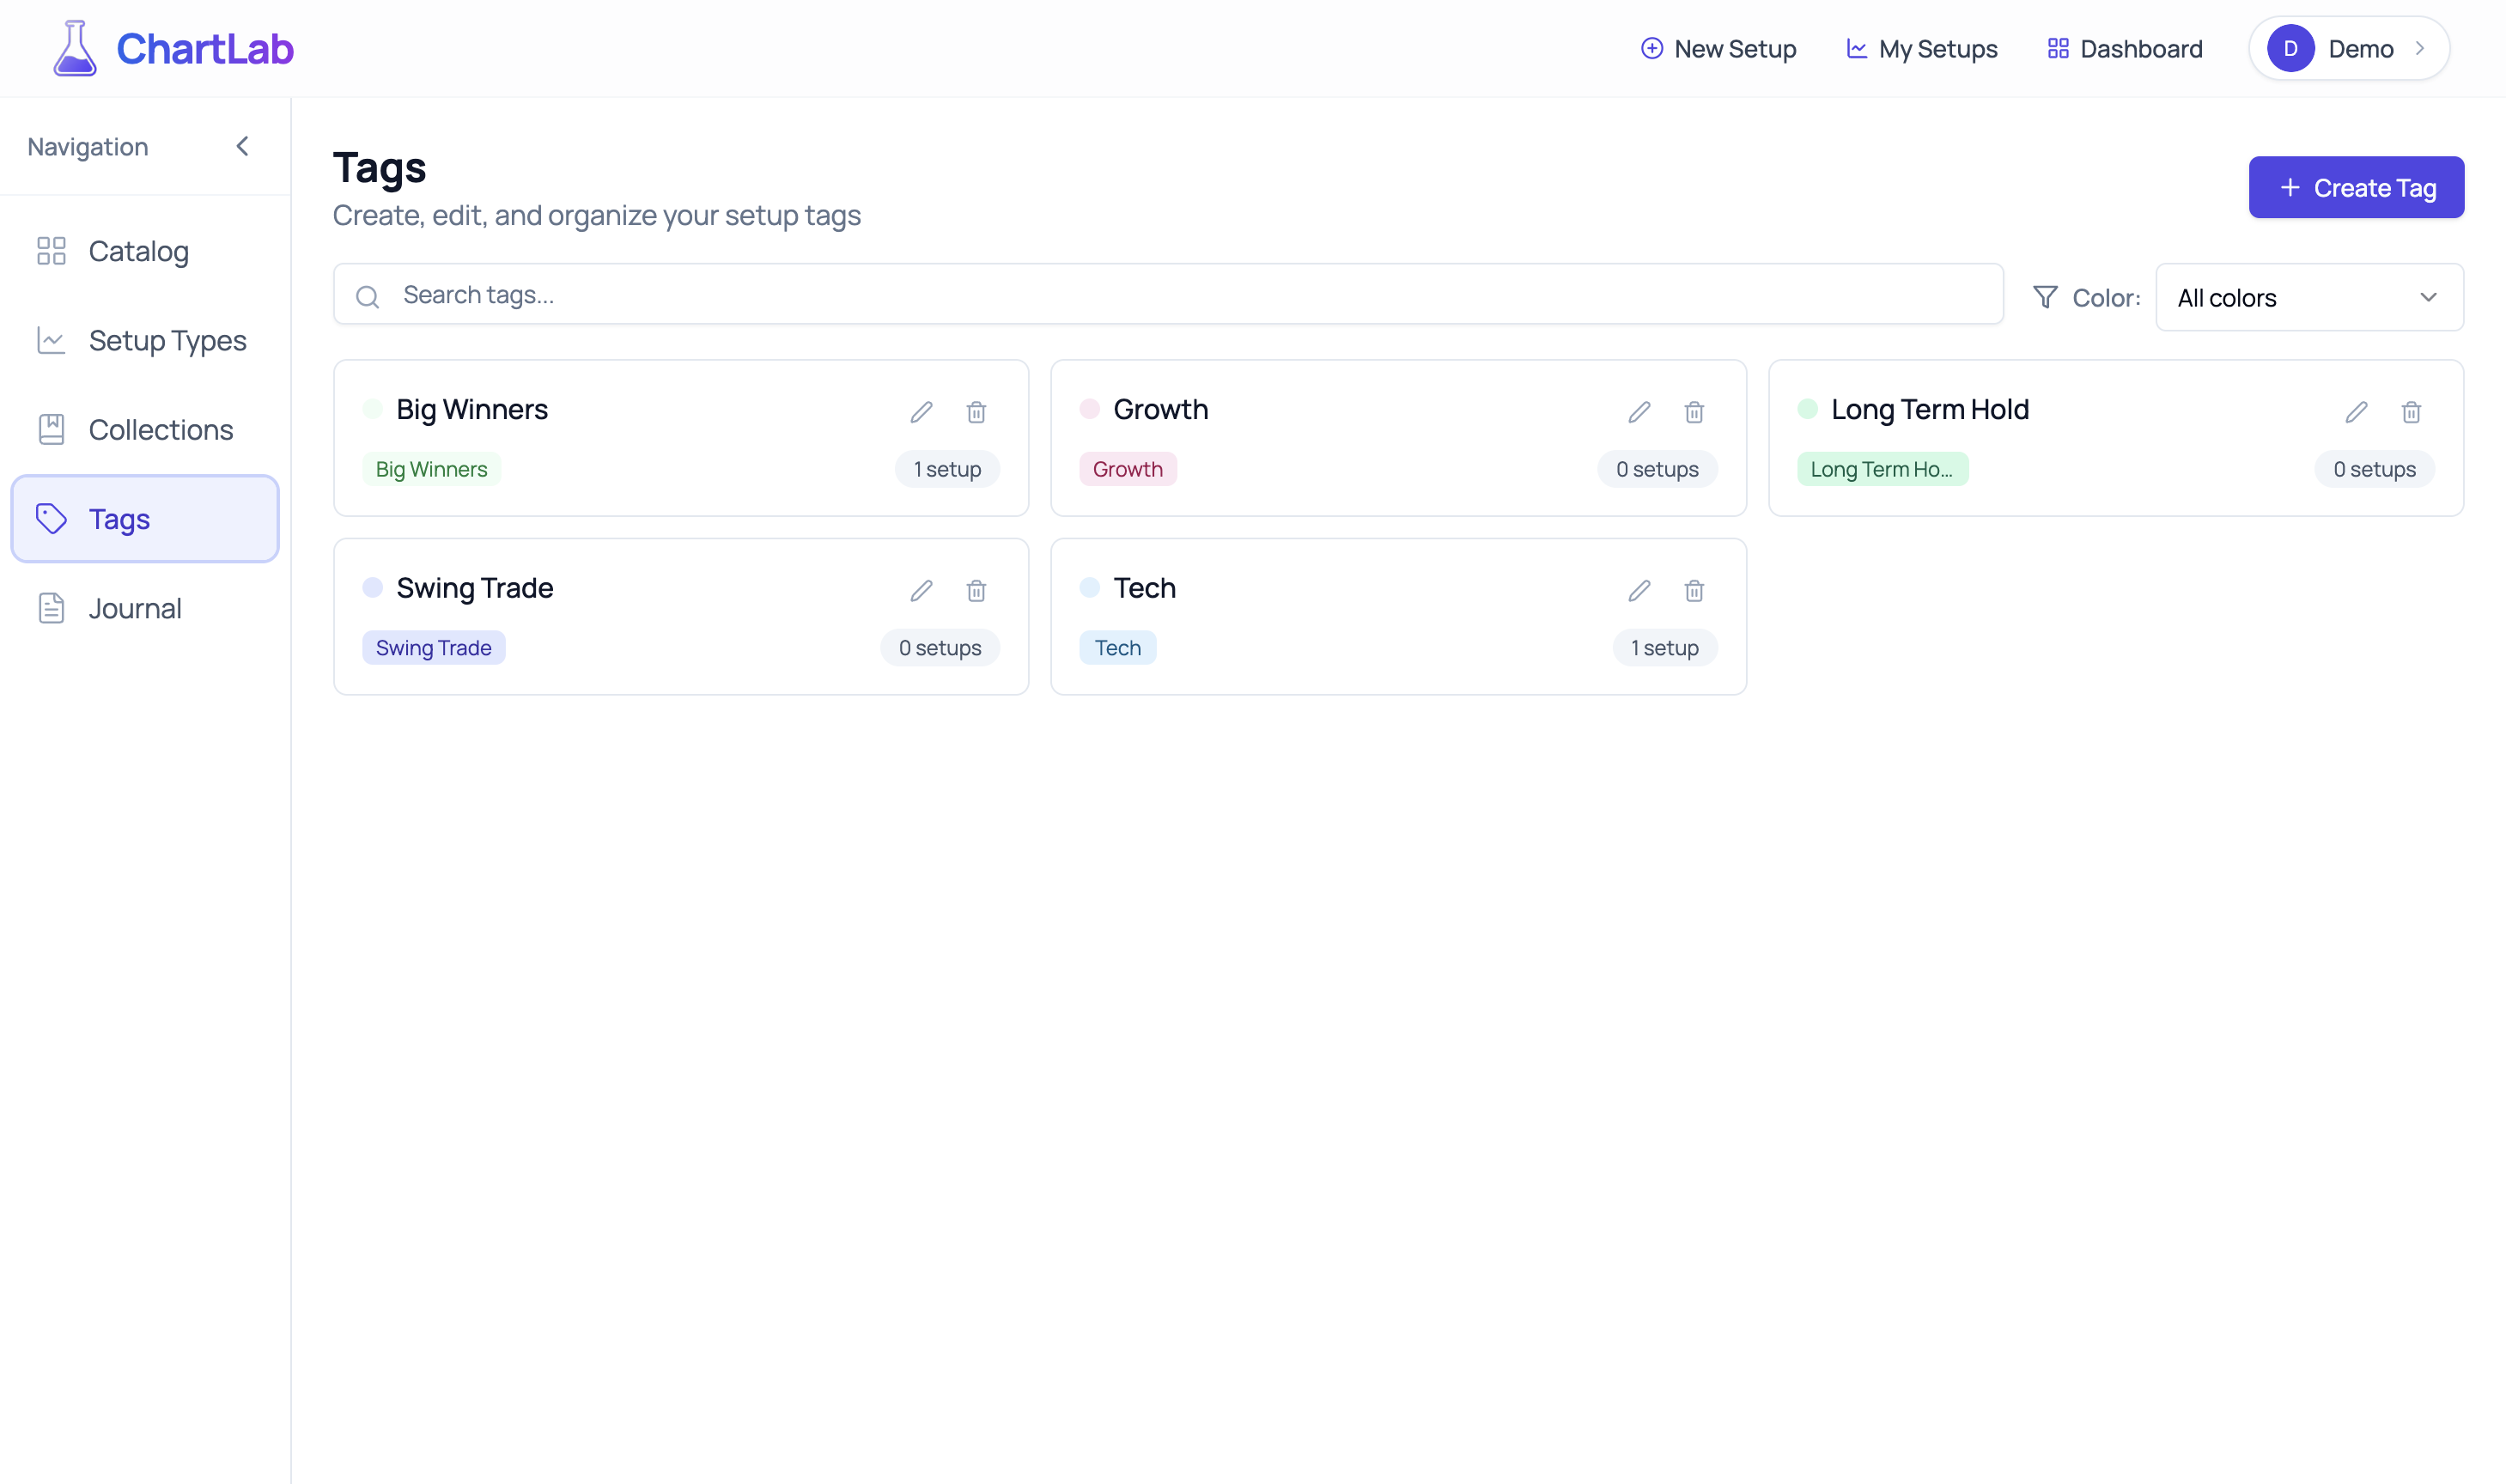
All tags view - Your tag management dashboard
Click "Create Tag" and build a tagging system that reflects how you think about the markets. When creating a tag, you can:
- Choose a name: Make it descriptive and meaningful
- Select a color: Pick from predefined color combinations for visual organization
- Apply immediately: Tags can be added to setup types during creation or to individual setups later
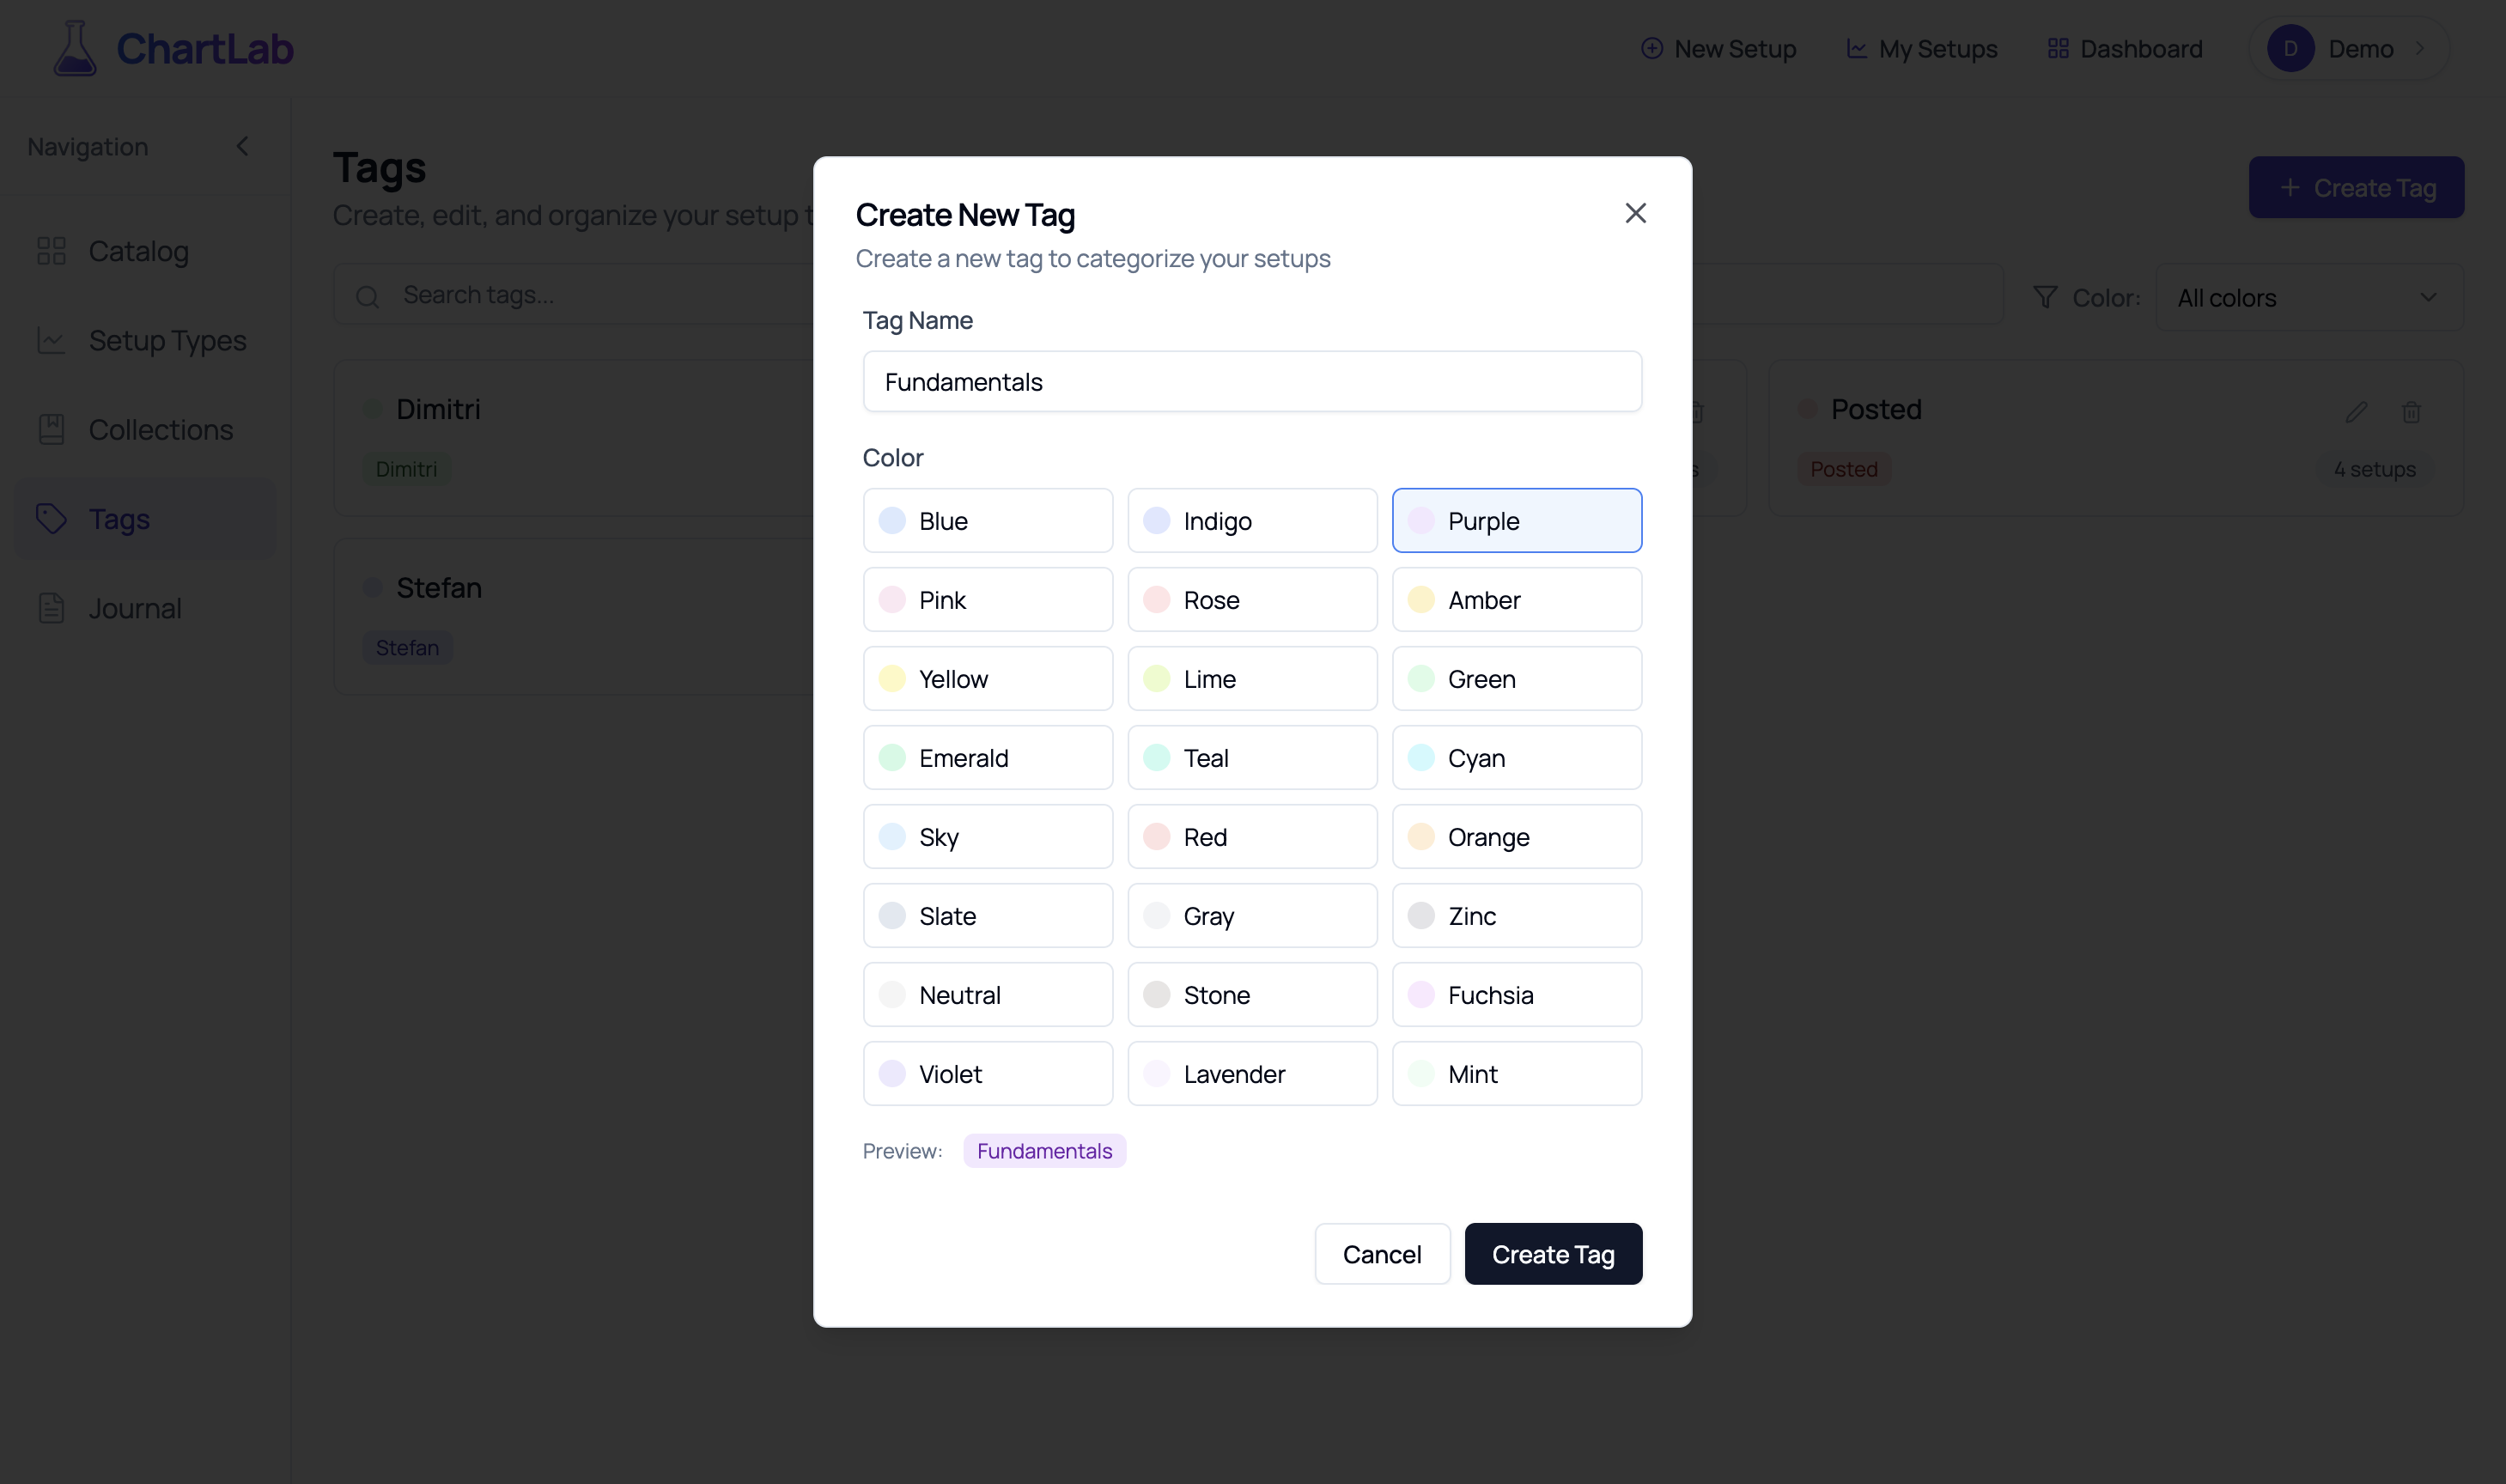
Create new tag dialog - Define your tag with color coding
Consider creating tags for:
- Market Conditions: Uptrend, Sideways, Bear Market Rally
- Success Indicators: High Conviction, Failed Setup, Partial Success
- Sectors/Themes: Tech, Healthcare, Small Cap, Crypto
- Time Periods: Earnings Season, Fed Meeting Week, Options Expiry
- Performance: Winner, Loser, Breakeven
Remember: Tags work across all elements in ChartLab - you can apply them to setups, setup types, and collections, giving you complete flexibility in organizing your research.
Document Your First Setup
Now for the exciting part - finding and documenting actual trading setups. Navigate to Add Setup from the main menu to enter ChartLab's powerful setup documentation interface.
Finding Your Perfect Symbol
The journey begins with symbol selection. ChartLab provides access to thousands of tradable instruments across multiple asset classes.
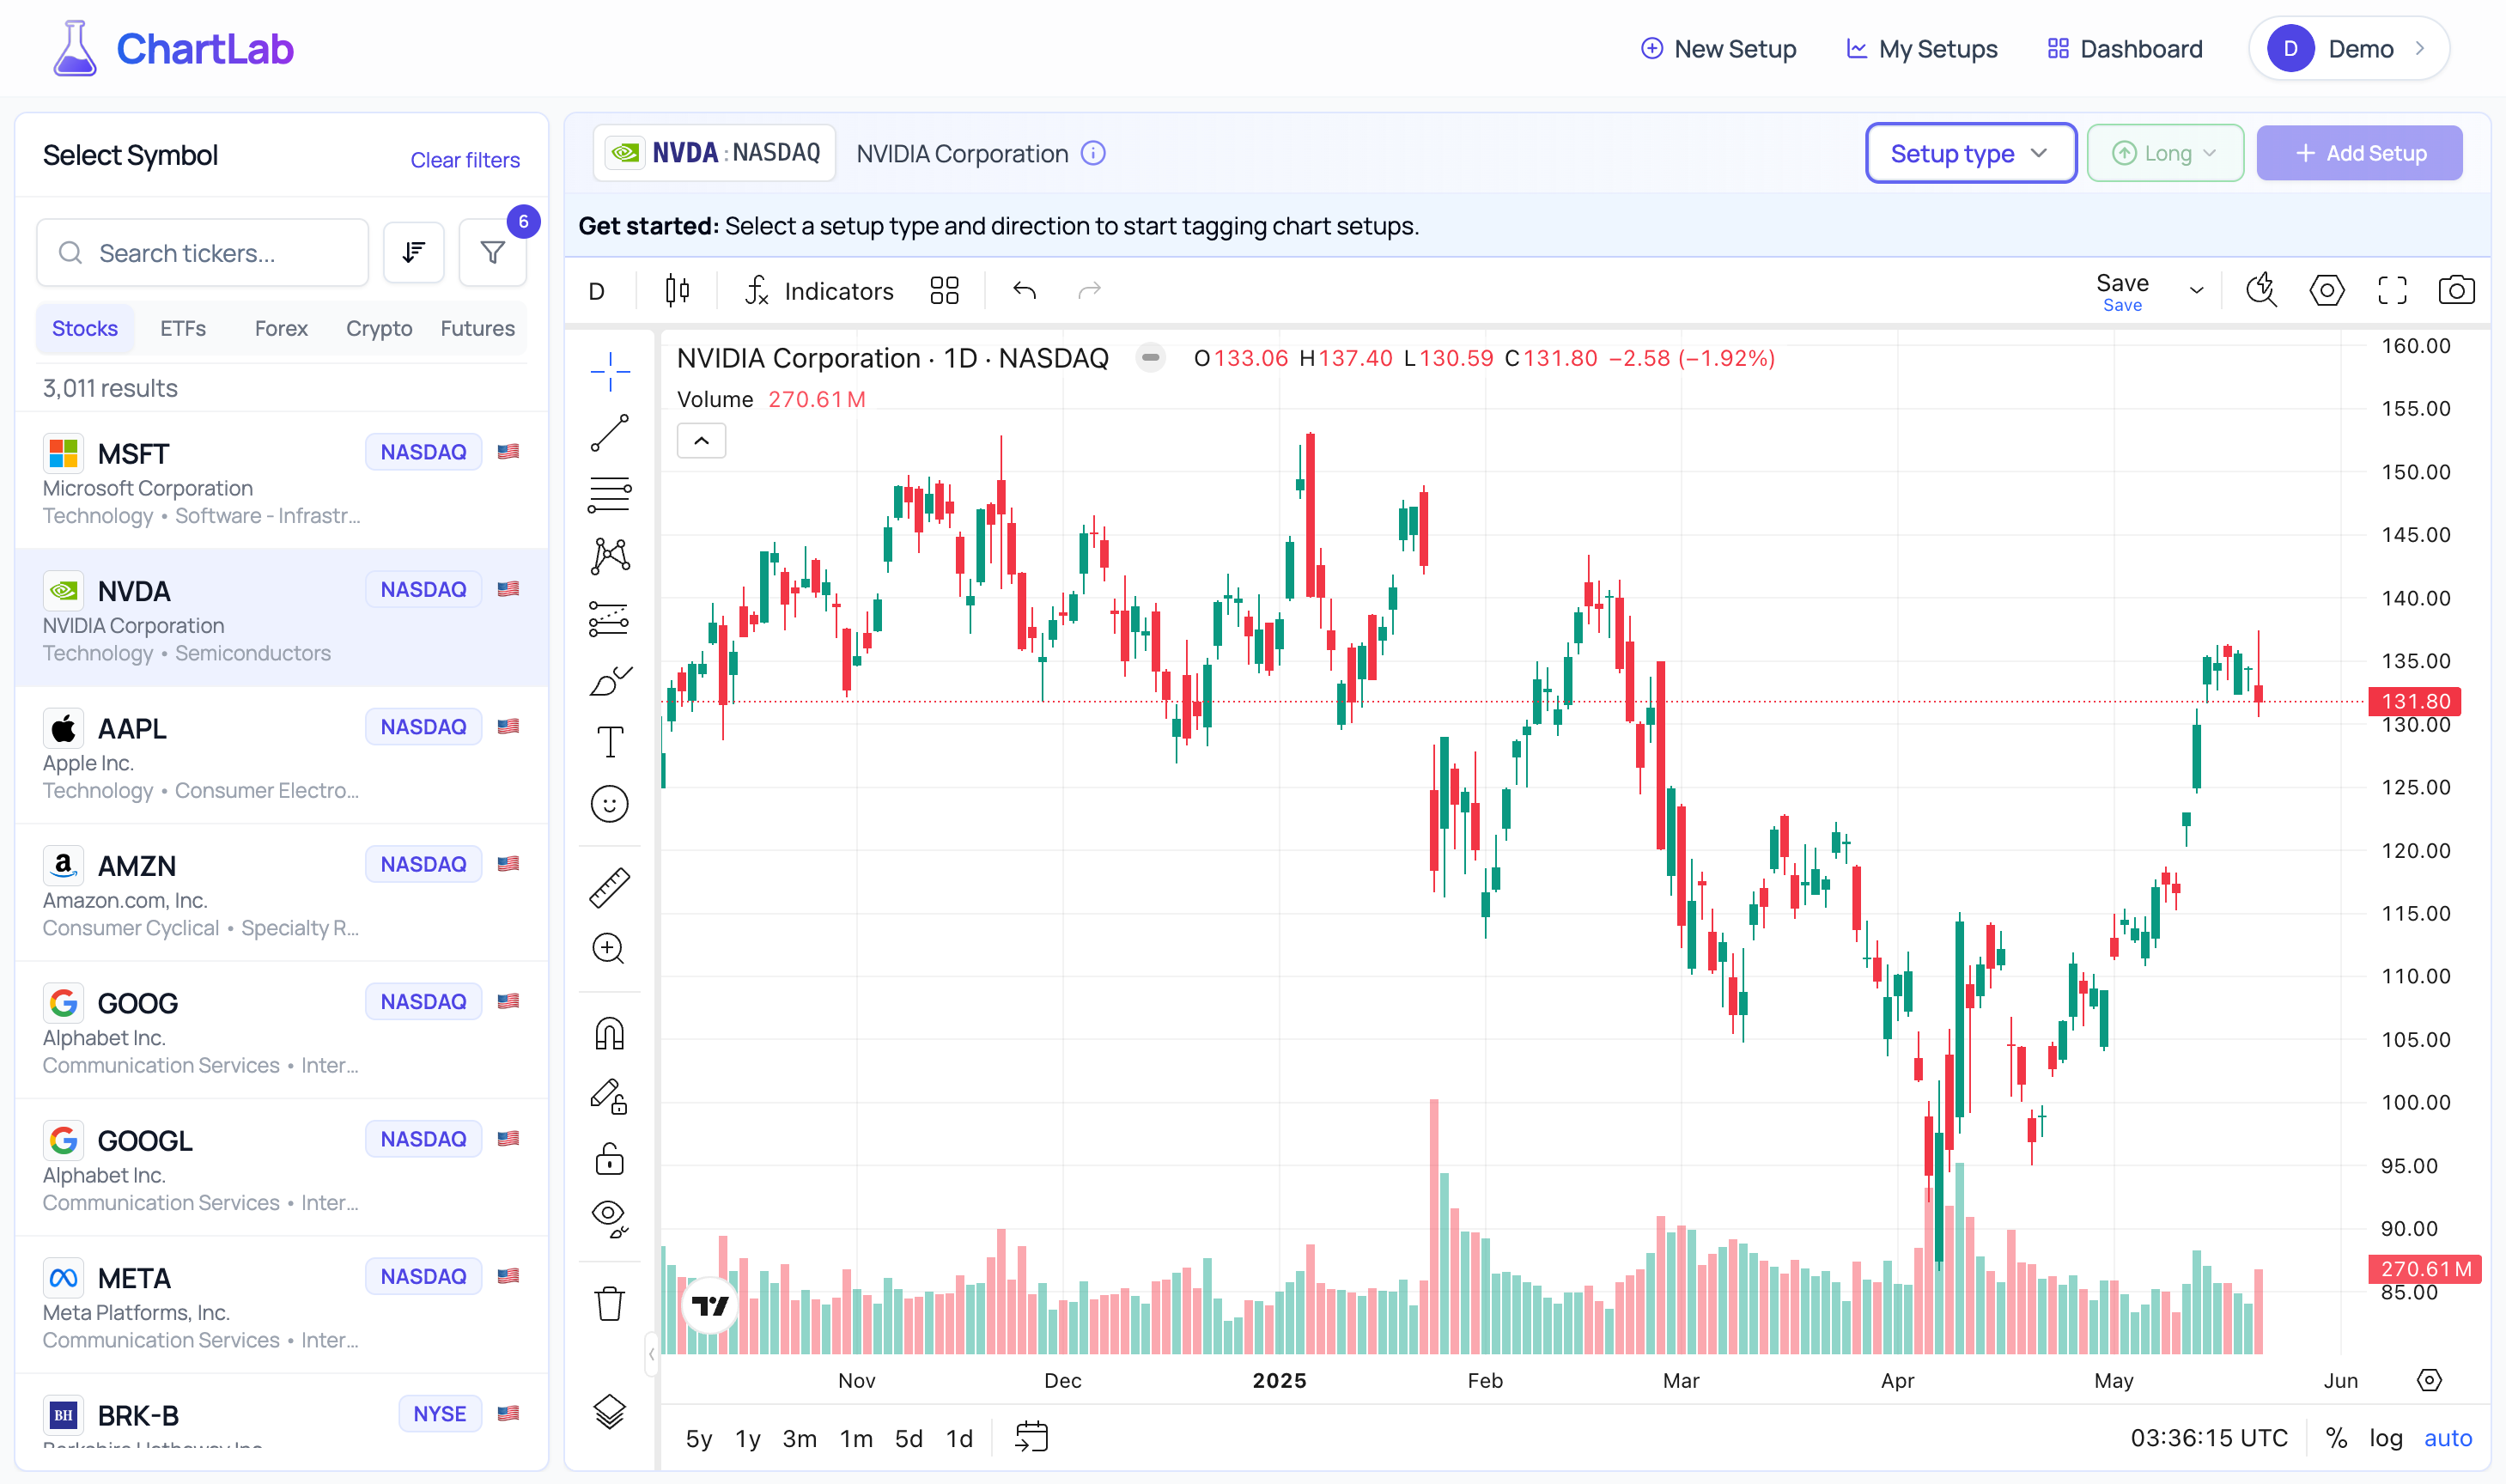
Symbol Selection - Your gateway to market opportunities
Advanced Filtering - Find Exactly What You're Looking For
Need to narrow down your search? Click the filter icon to access ChartLab's sophisticated filtering system. You can filter by exchange, sector, industry, country, market cap, volume, and price ranges to find exactly the type of securities you're interested in.
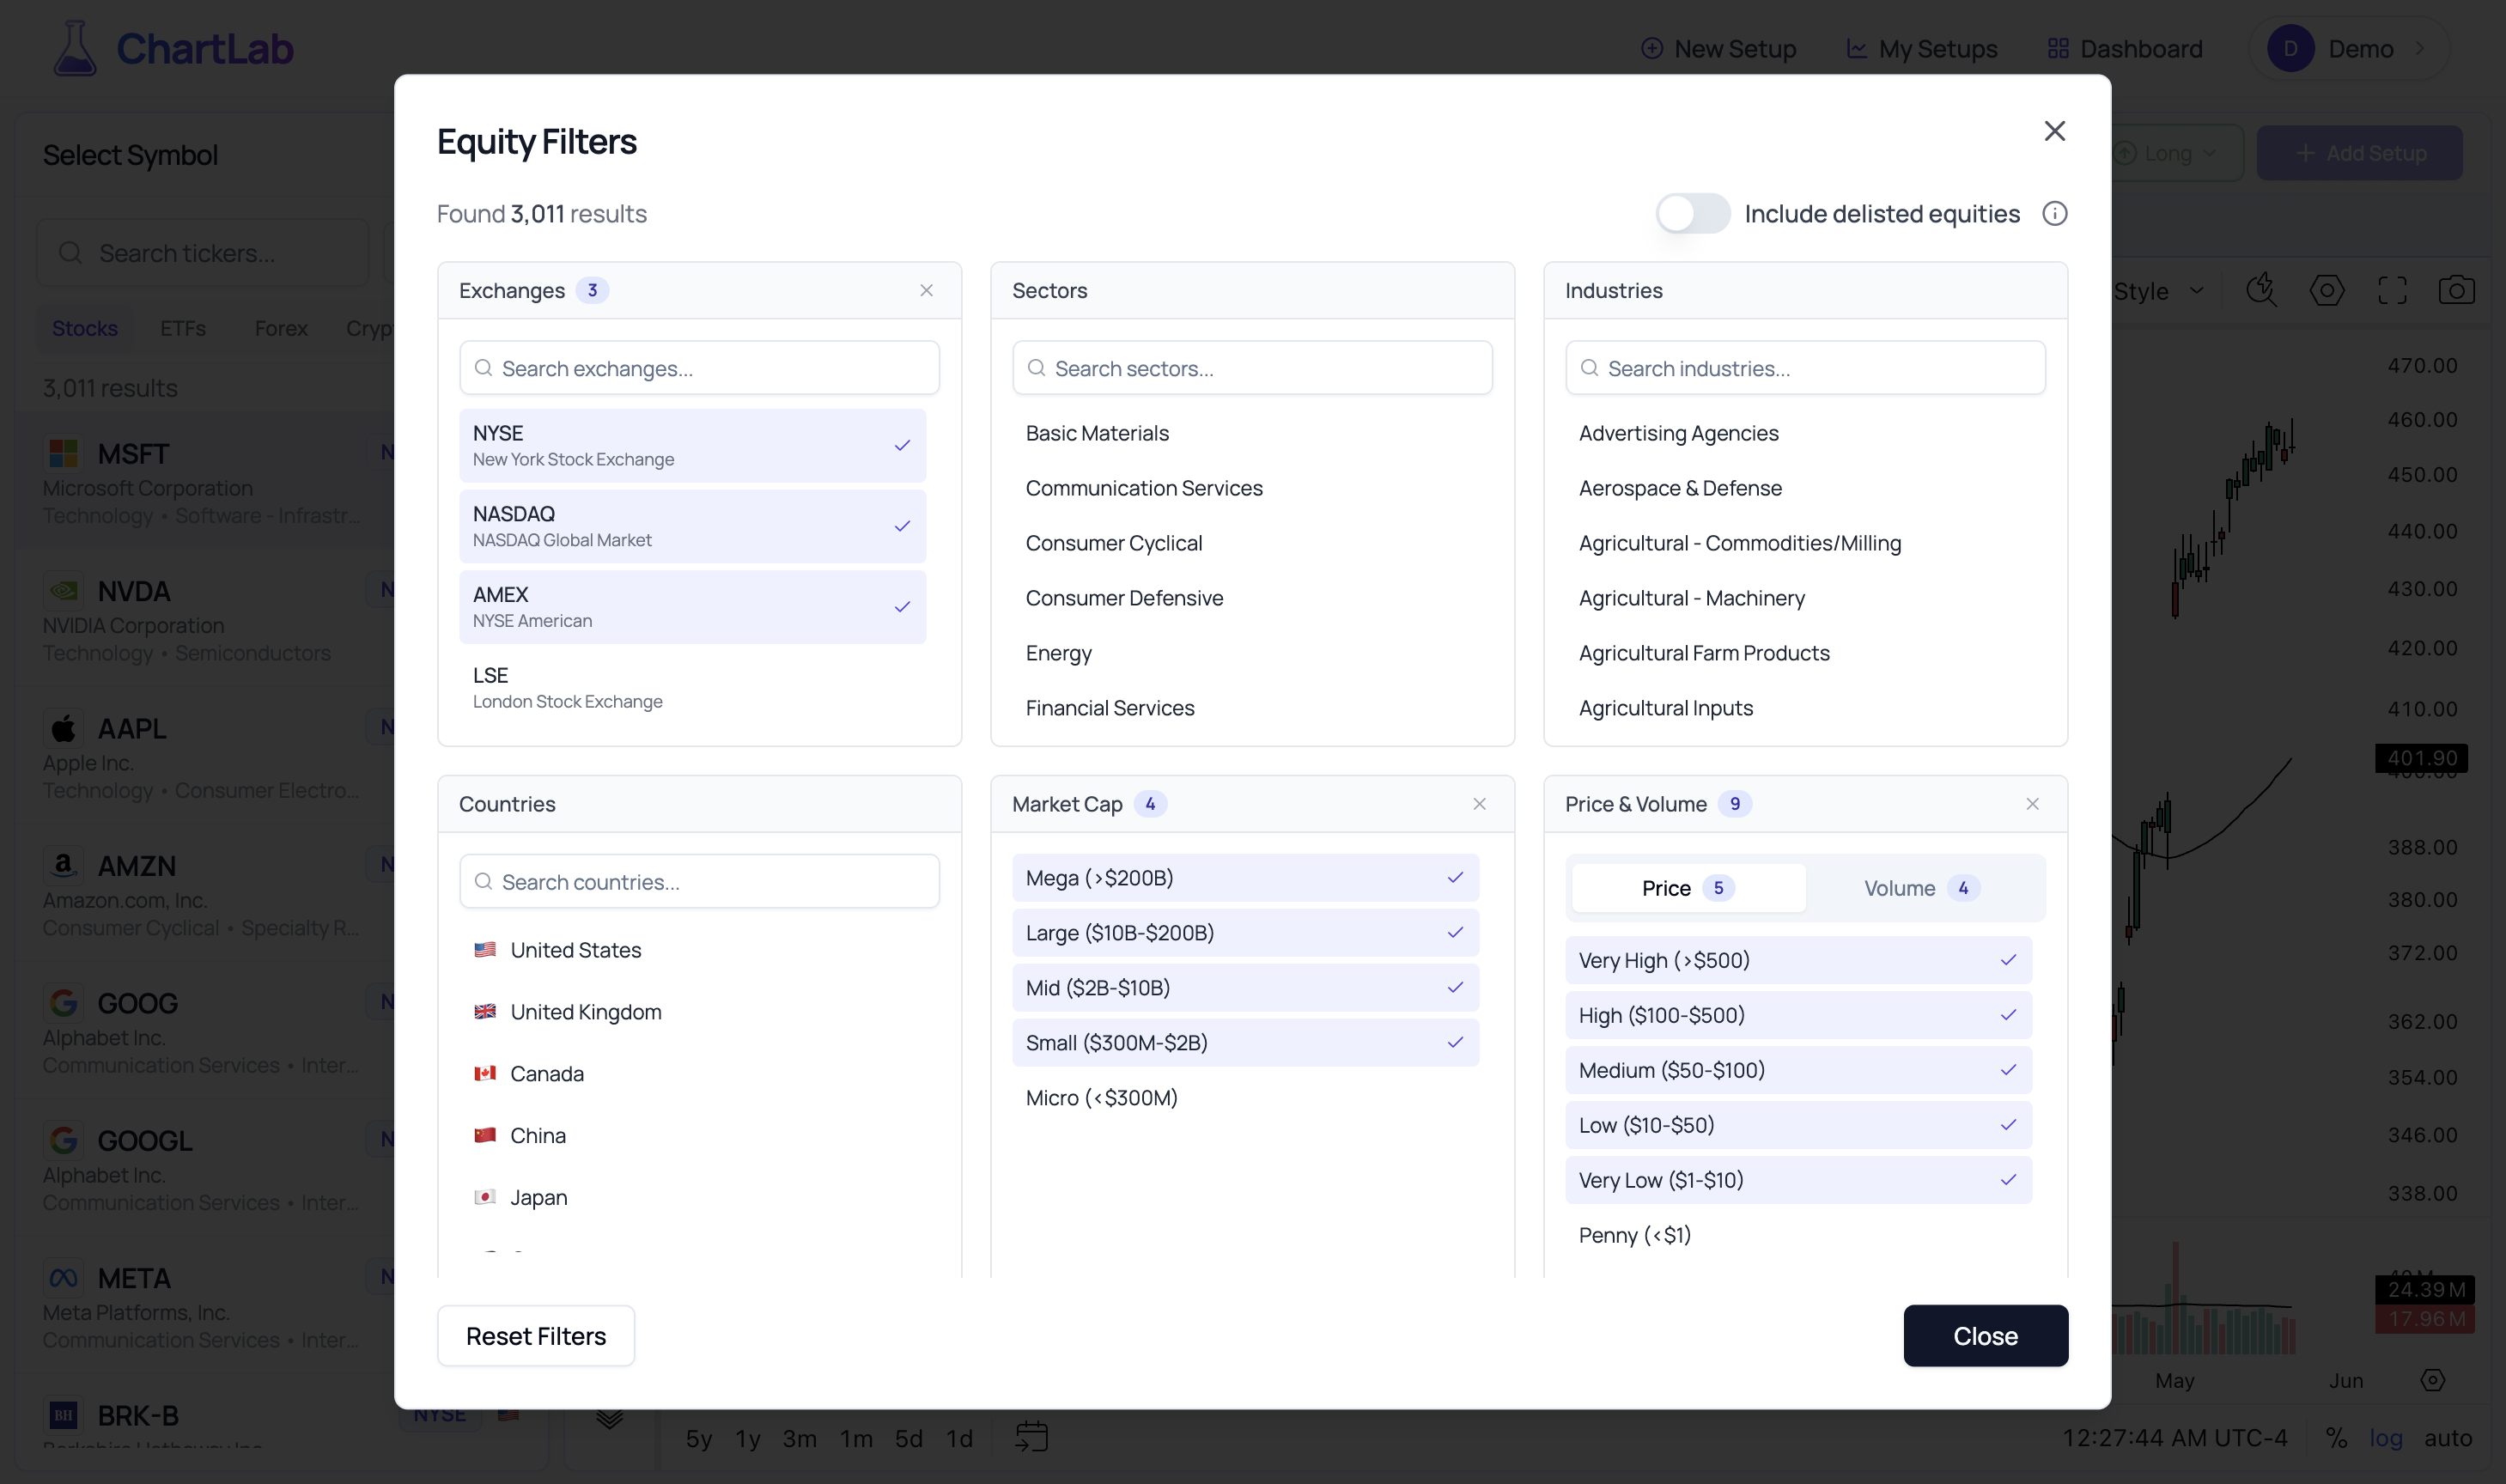
Advanced Equity Filters - Precision symbol discovery
Coming Soon - Point-in-Time Screening: We're developing an advanced screening feature that will revolutionize how you discover setups. Instead of manually searching through individual charts, you'll be able to create custom screens that return every historical instance where your criteria were met across all symbols and timeframes. This feature is currently under development and will be introduced in a future update.
For example, if you're looking for volatility contraction patterns, our point-in-time screener will show you every occurrence across thousands of symbols over decades of data. Want to find every time a stock broke above its 20-day moving average on 3x normal volume? The screener will present you with every single instance, allowing you to study patterns at scale and build conviction through statistical analysis rather than cherry-picked examples.
This feature will transform setup discovery from a manual hunt-and-peck process into a systematic exploration of market behavior across all conditions and time periods.
Setting Up Your Chart
Once you've loaded a symbol, you're presented with ChartLab's integrated TradingView charting interface - but this is where ChartLab's magic begins.
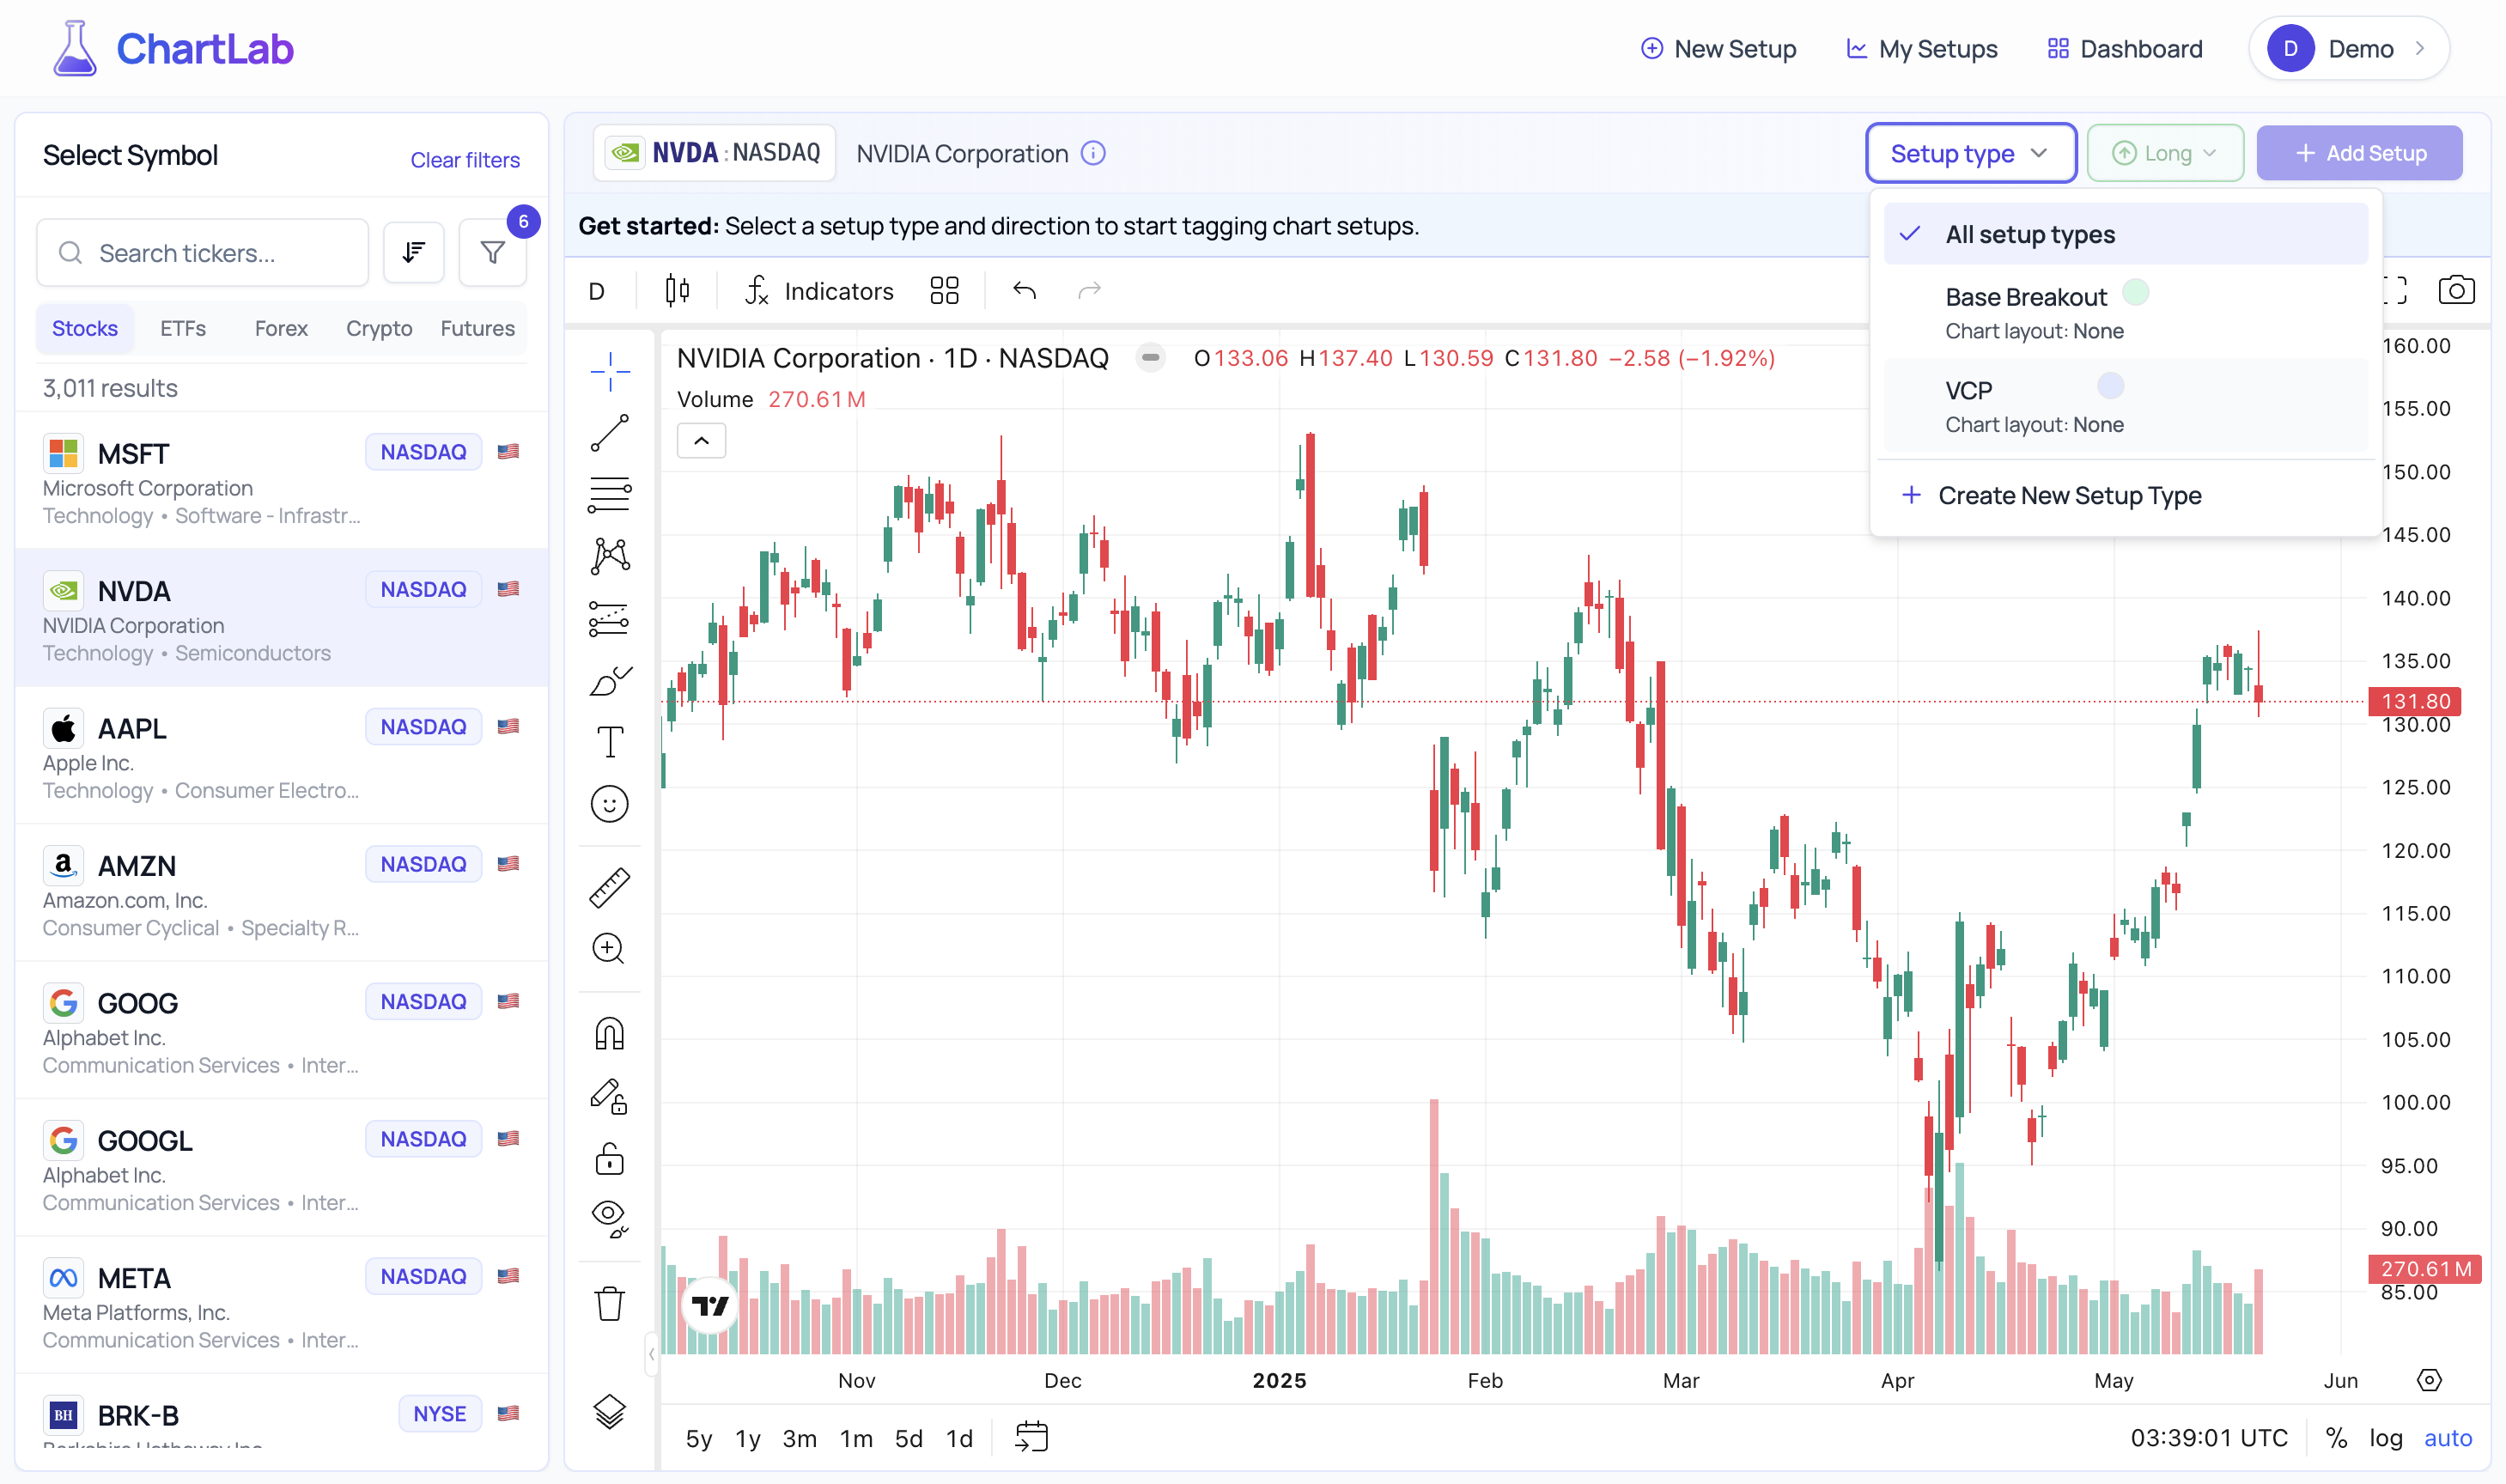
Select Setup Type - Choose your pattern framework
Choose Your Analysis Timeframe
Different patterns reveal themselves on different timeframes. ChartLab gives you complete control over your temporal perspective.
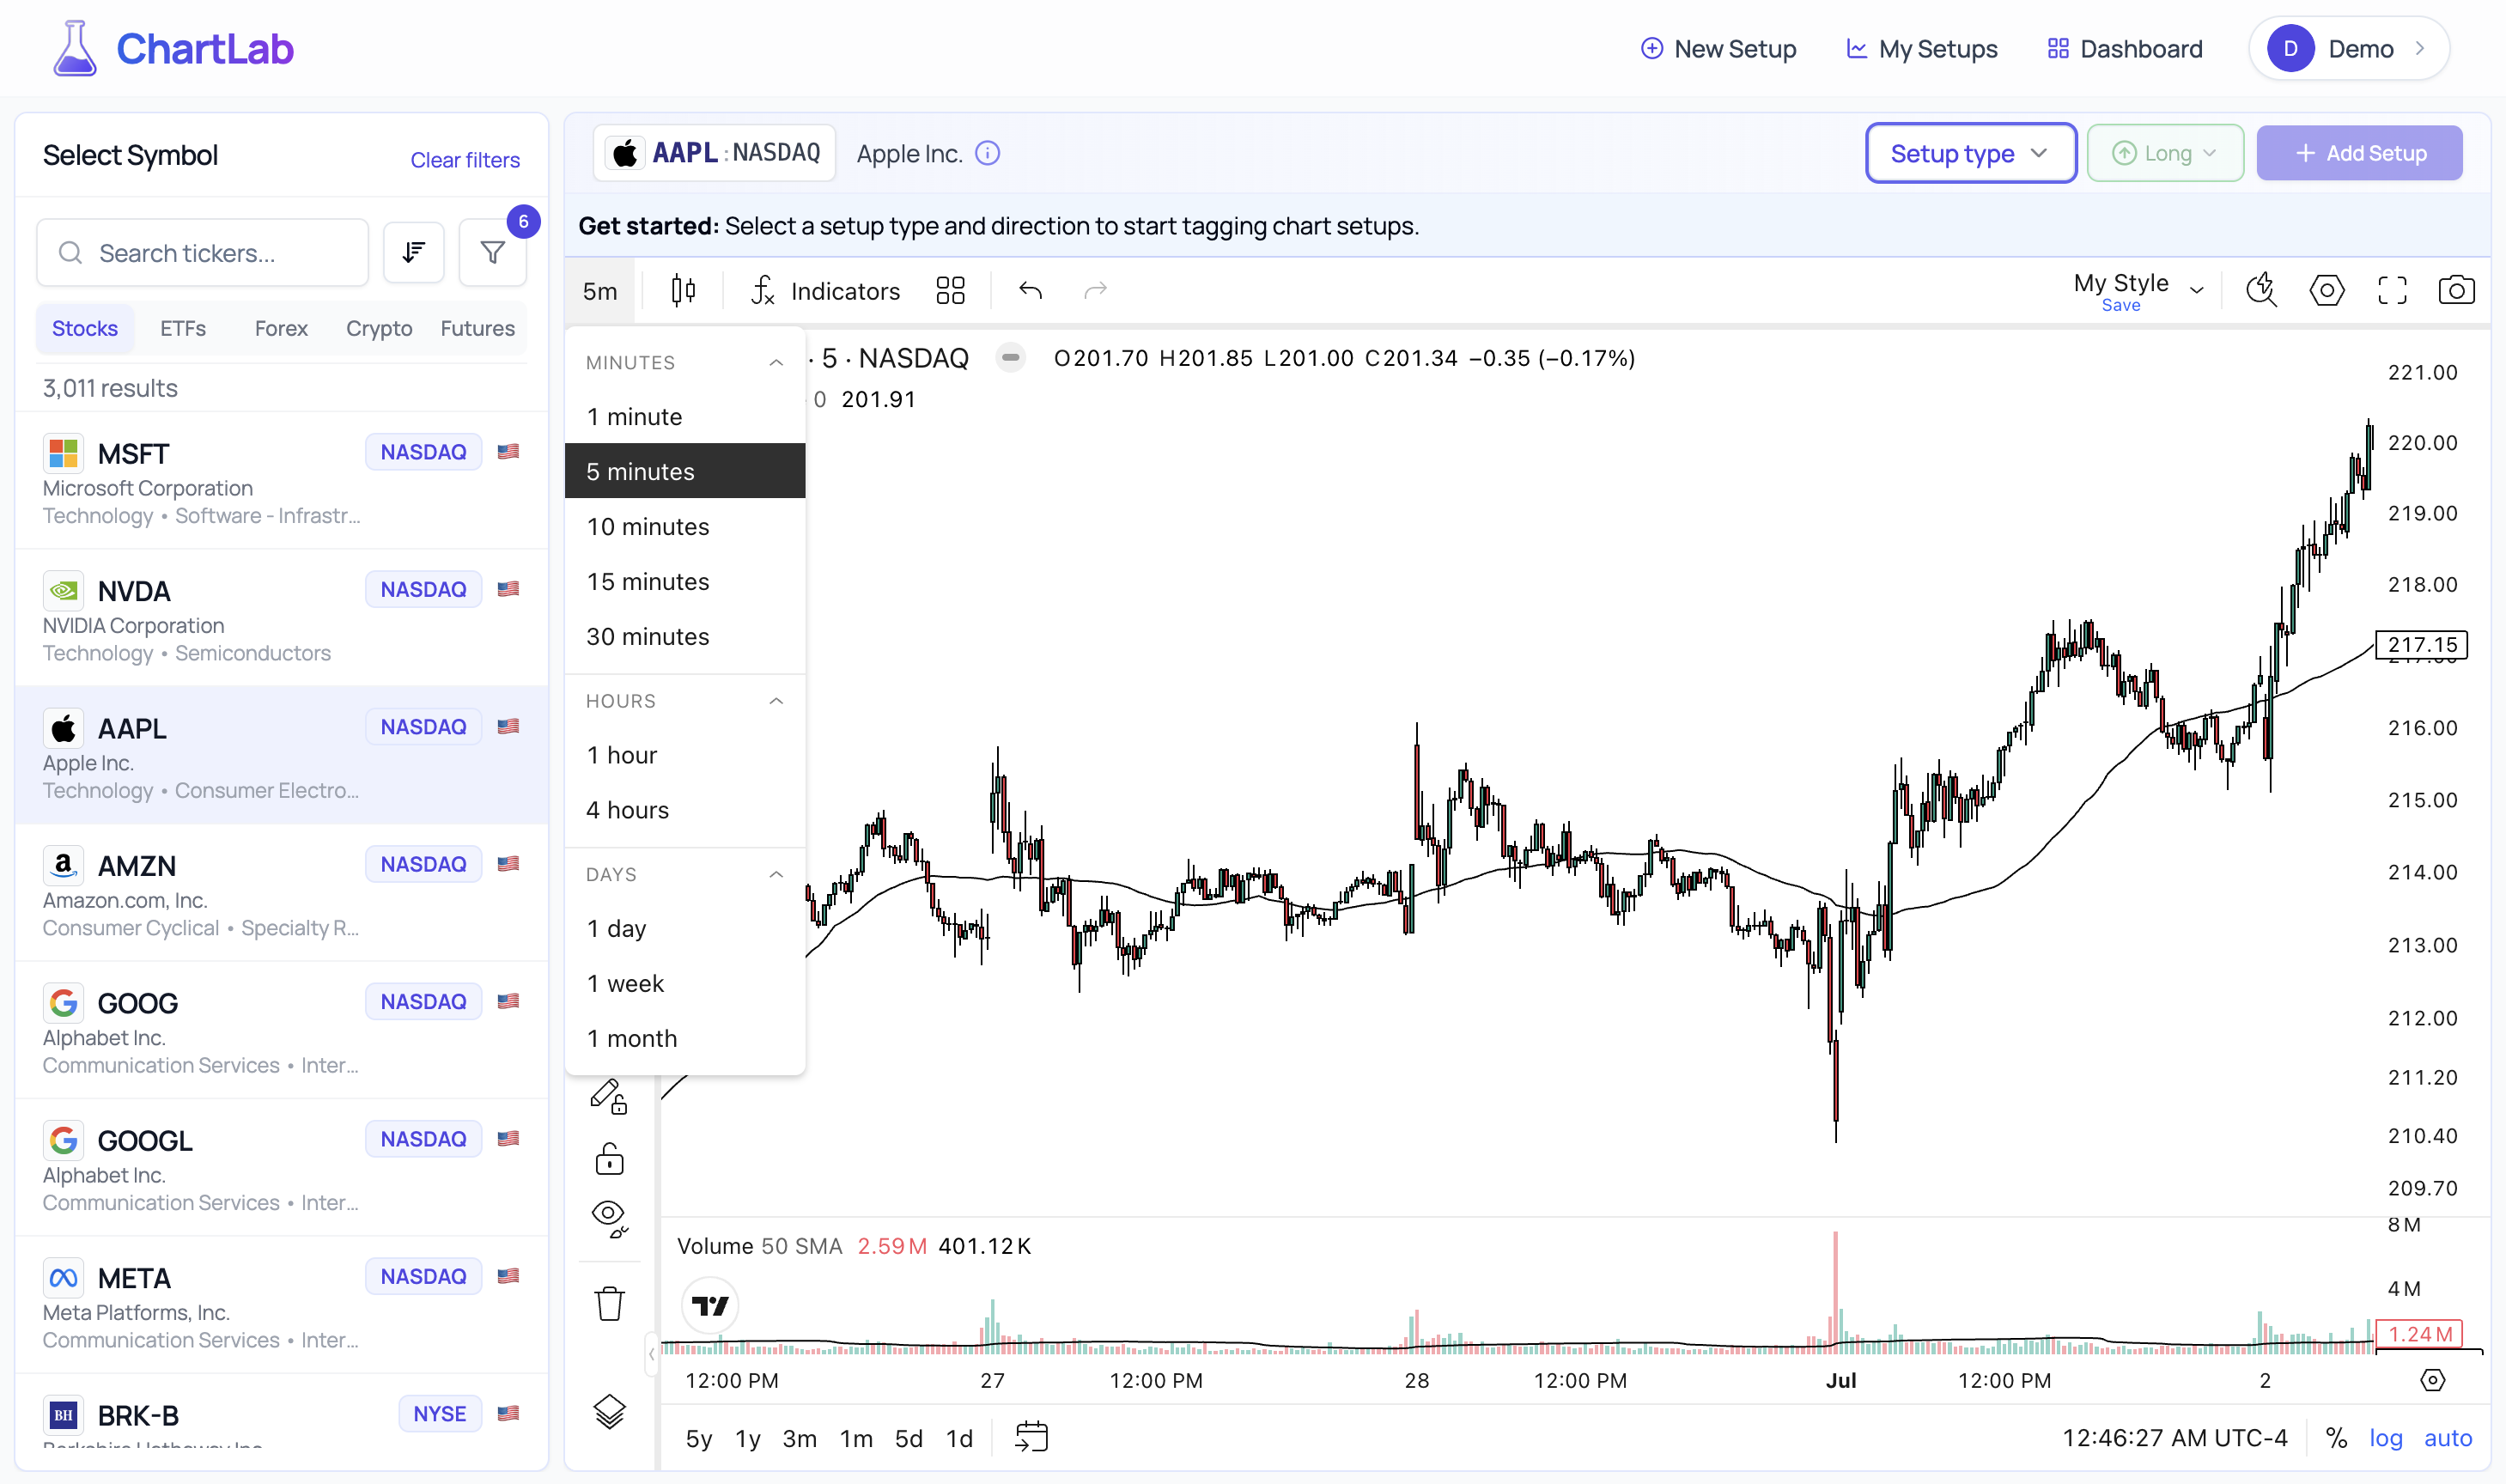
Chart Resolution Selection - From minutes to months
Apply Technical Analysis
Access TradingView's complete library of technical indicators to enhance your pattern recognition.
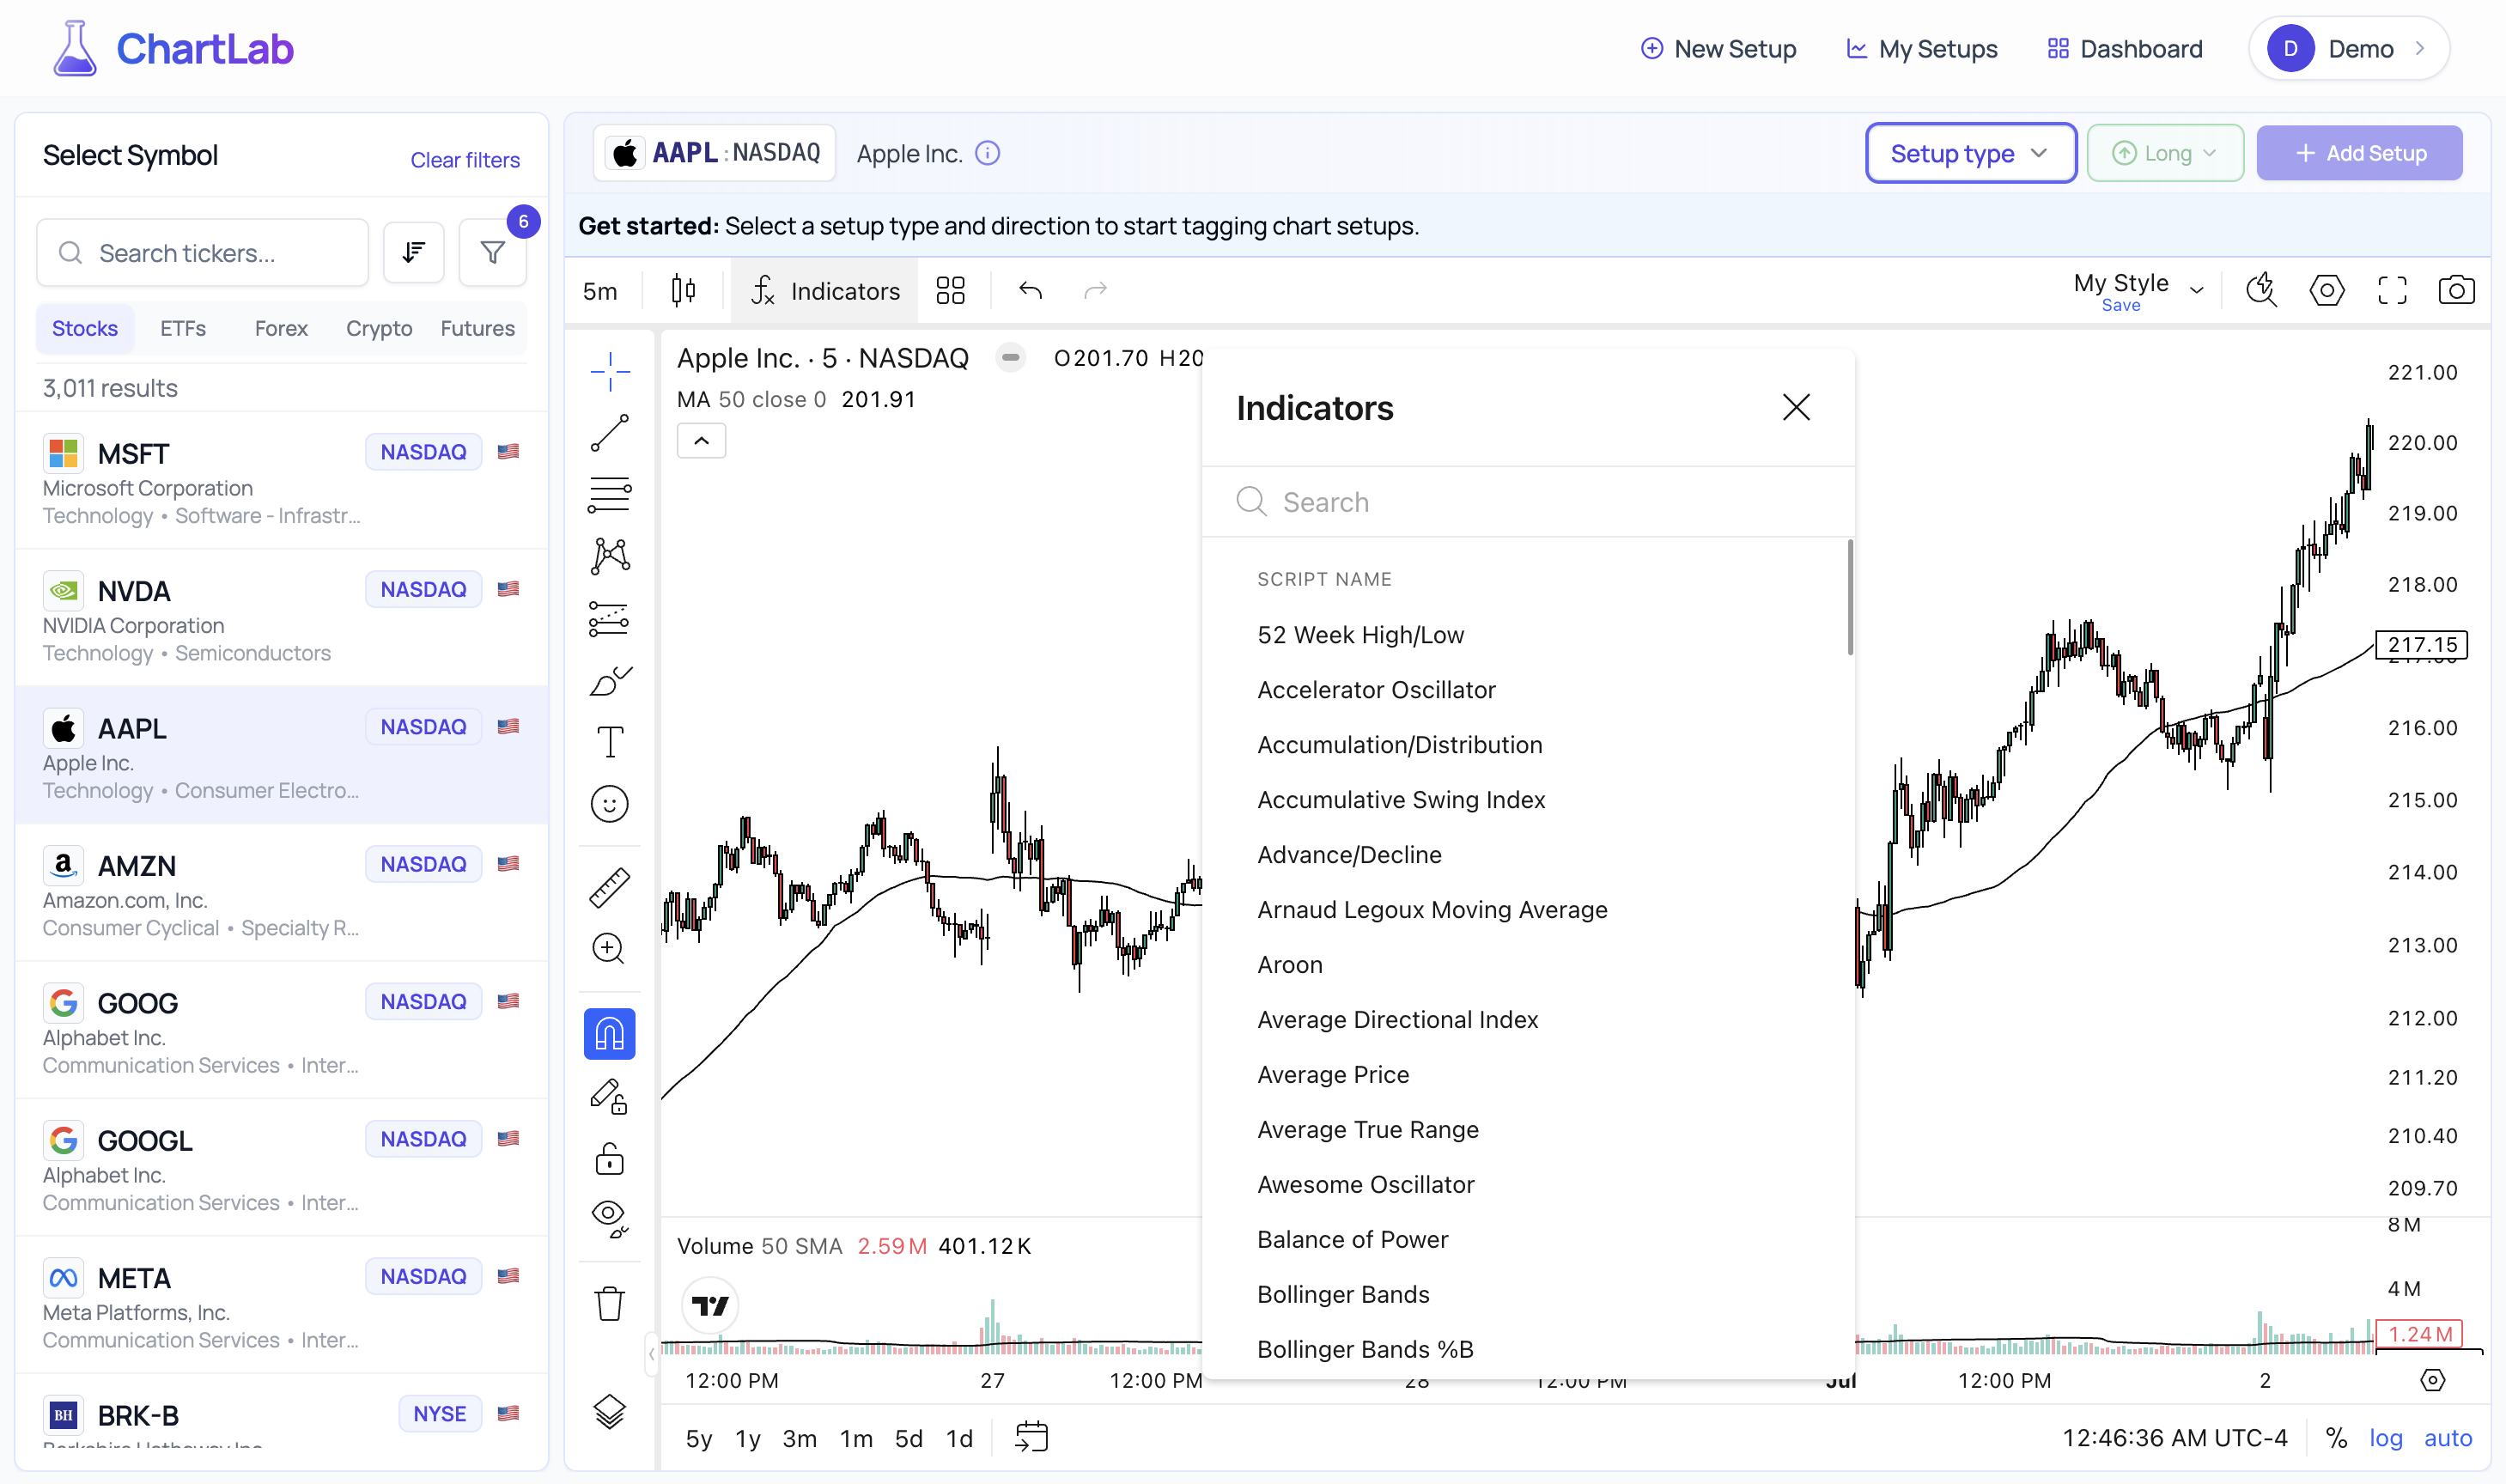
TradingView Indicators Panel - Professional-grade analysis tools
Save Your Chart Configuration
Found the perfect indicator combination? Save it as a reusable chart layout.
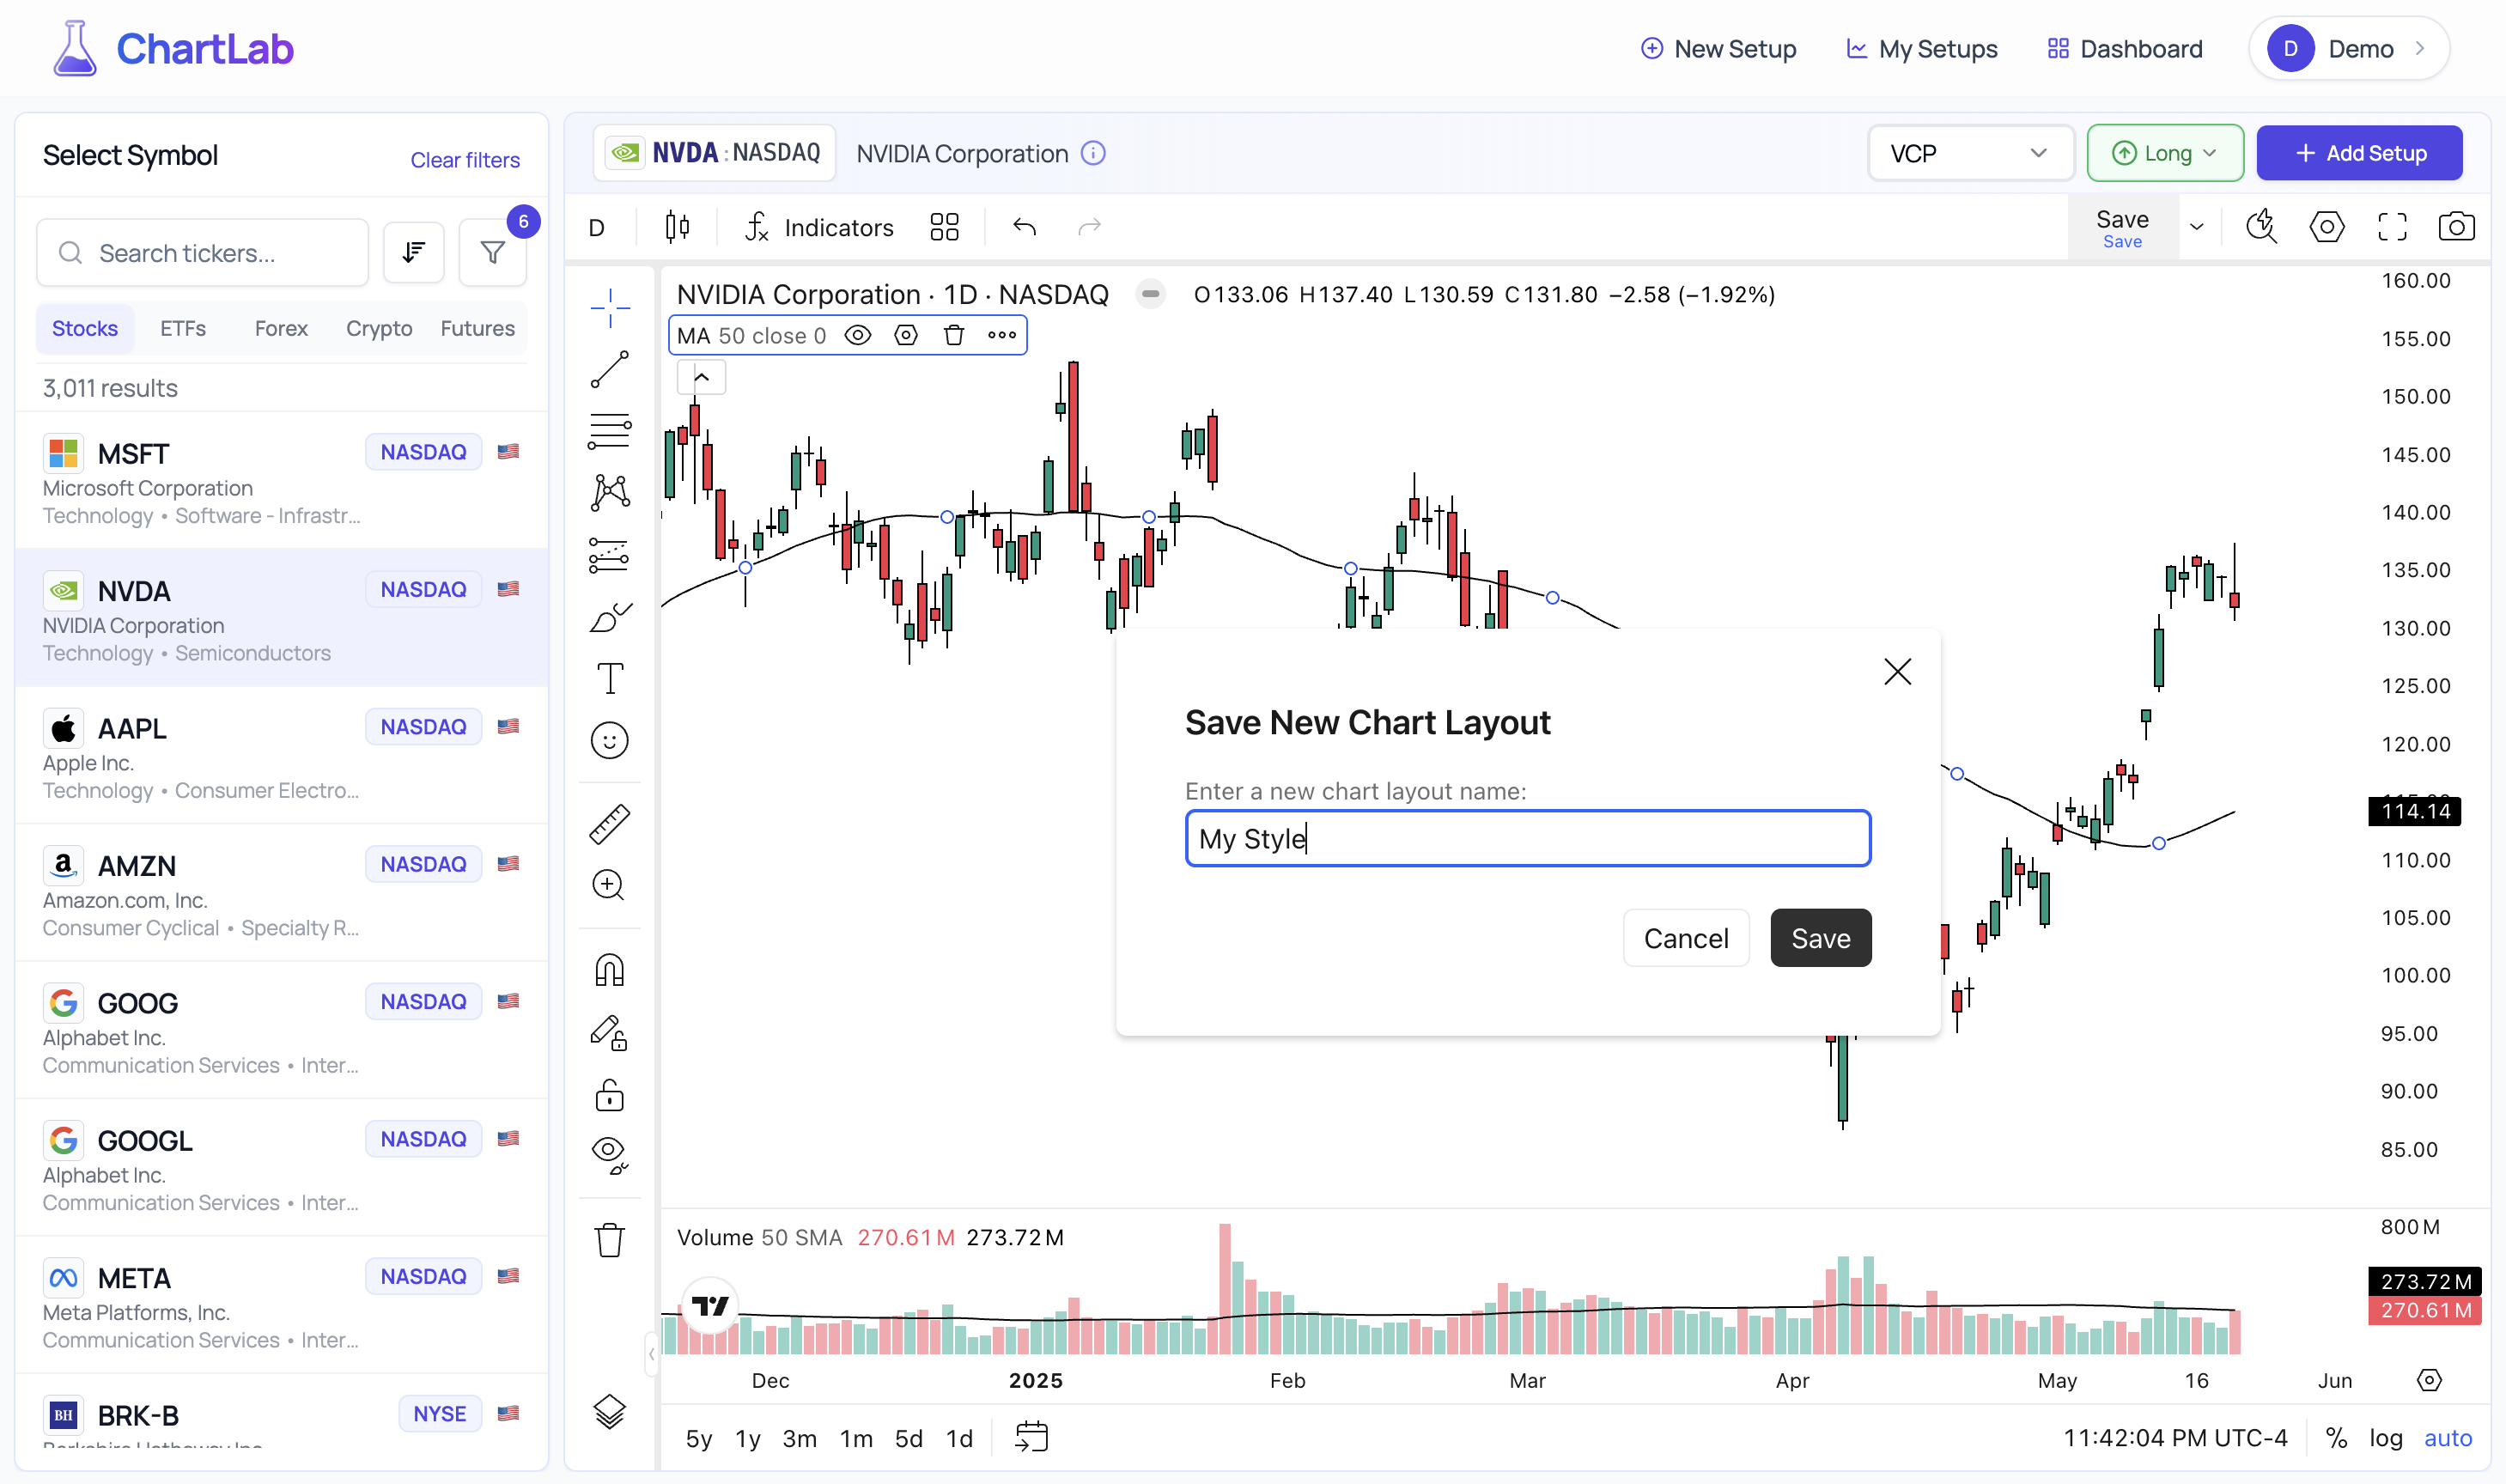
Save Chart Layout Dialog - Build your analysis toolkit
Connecting Chart Layouts to Setup Types: After saving a chart layout, you can return to your Setup Types page (via the Catalog) and edit any setup type to associate this layout with it. This creates a powerful workflow where selecting a setup type automatically loads your preferred technical analysis configuration.
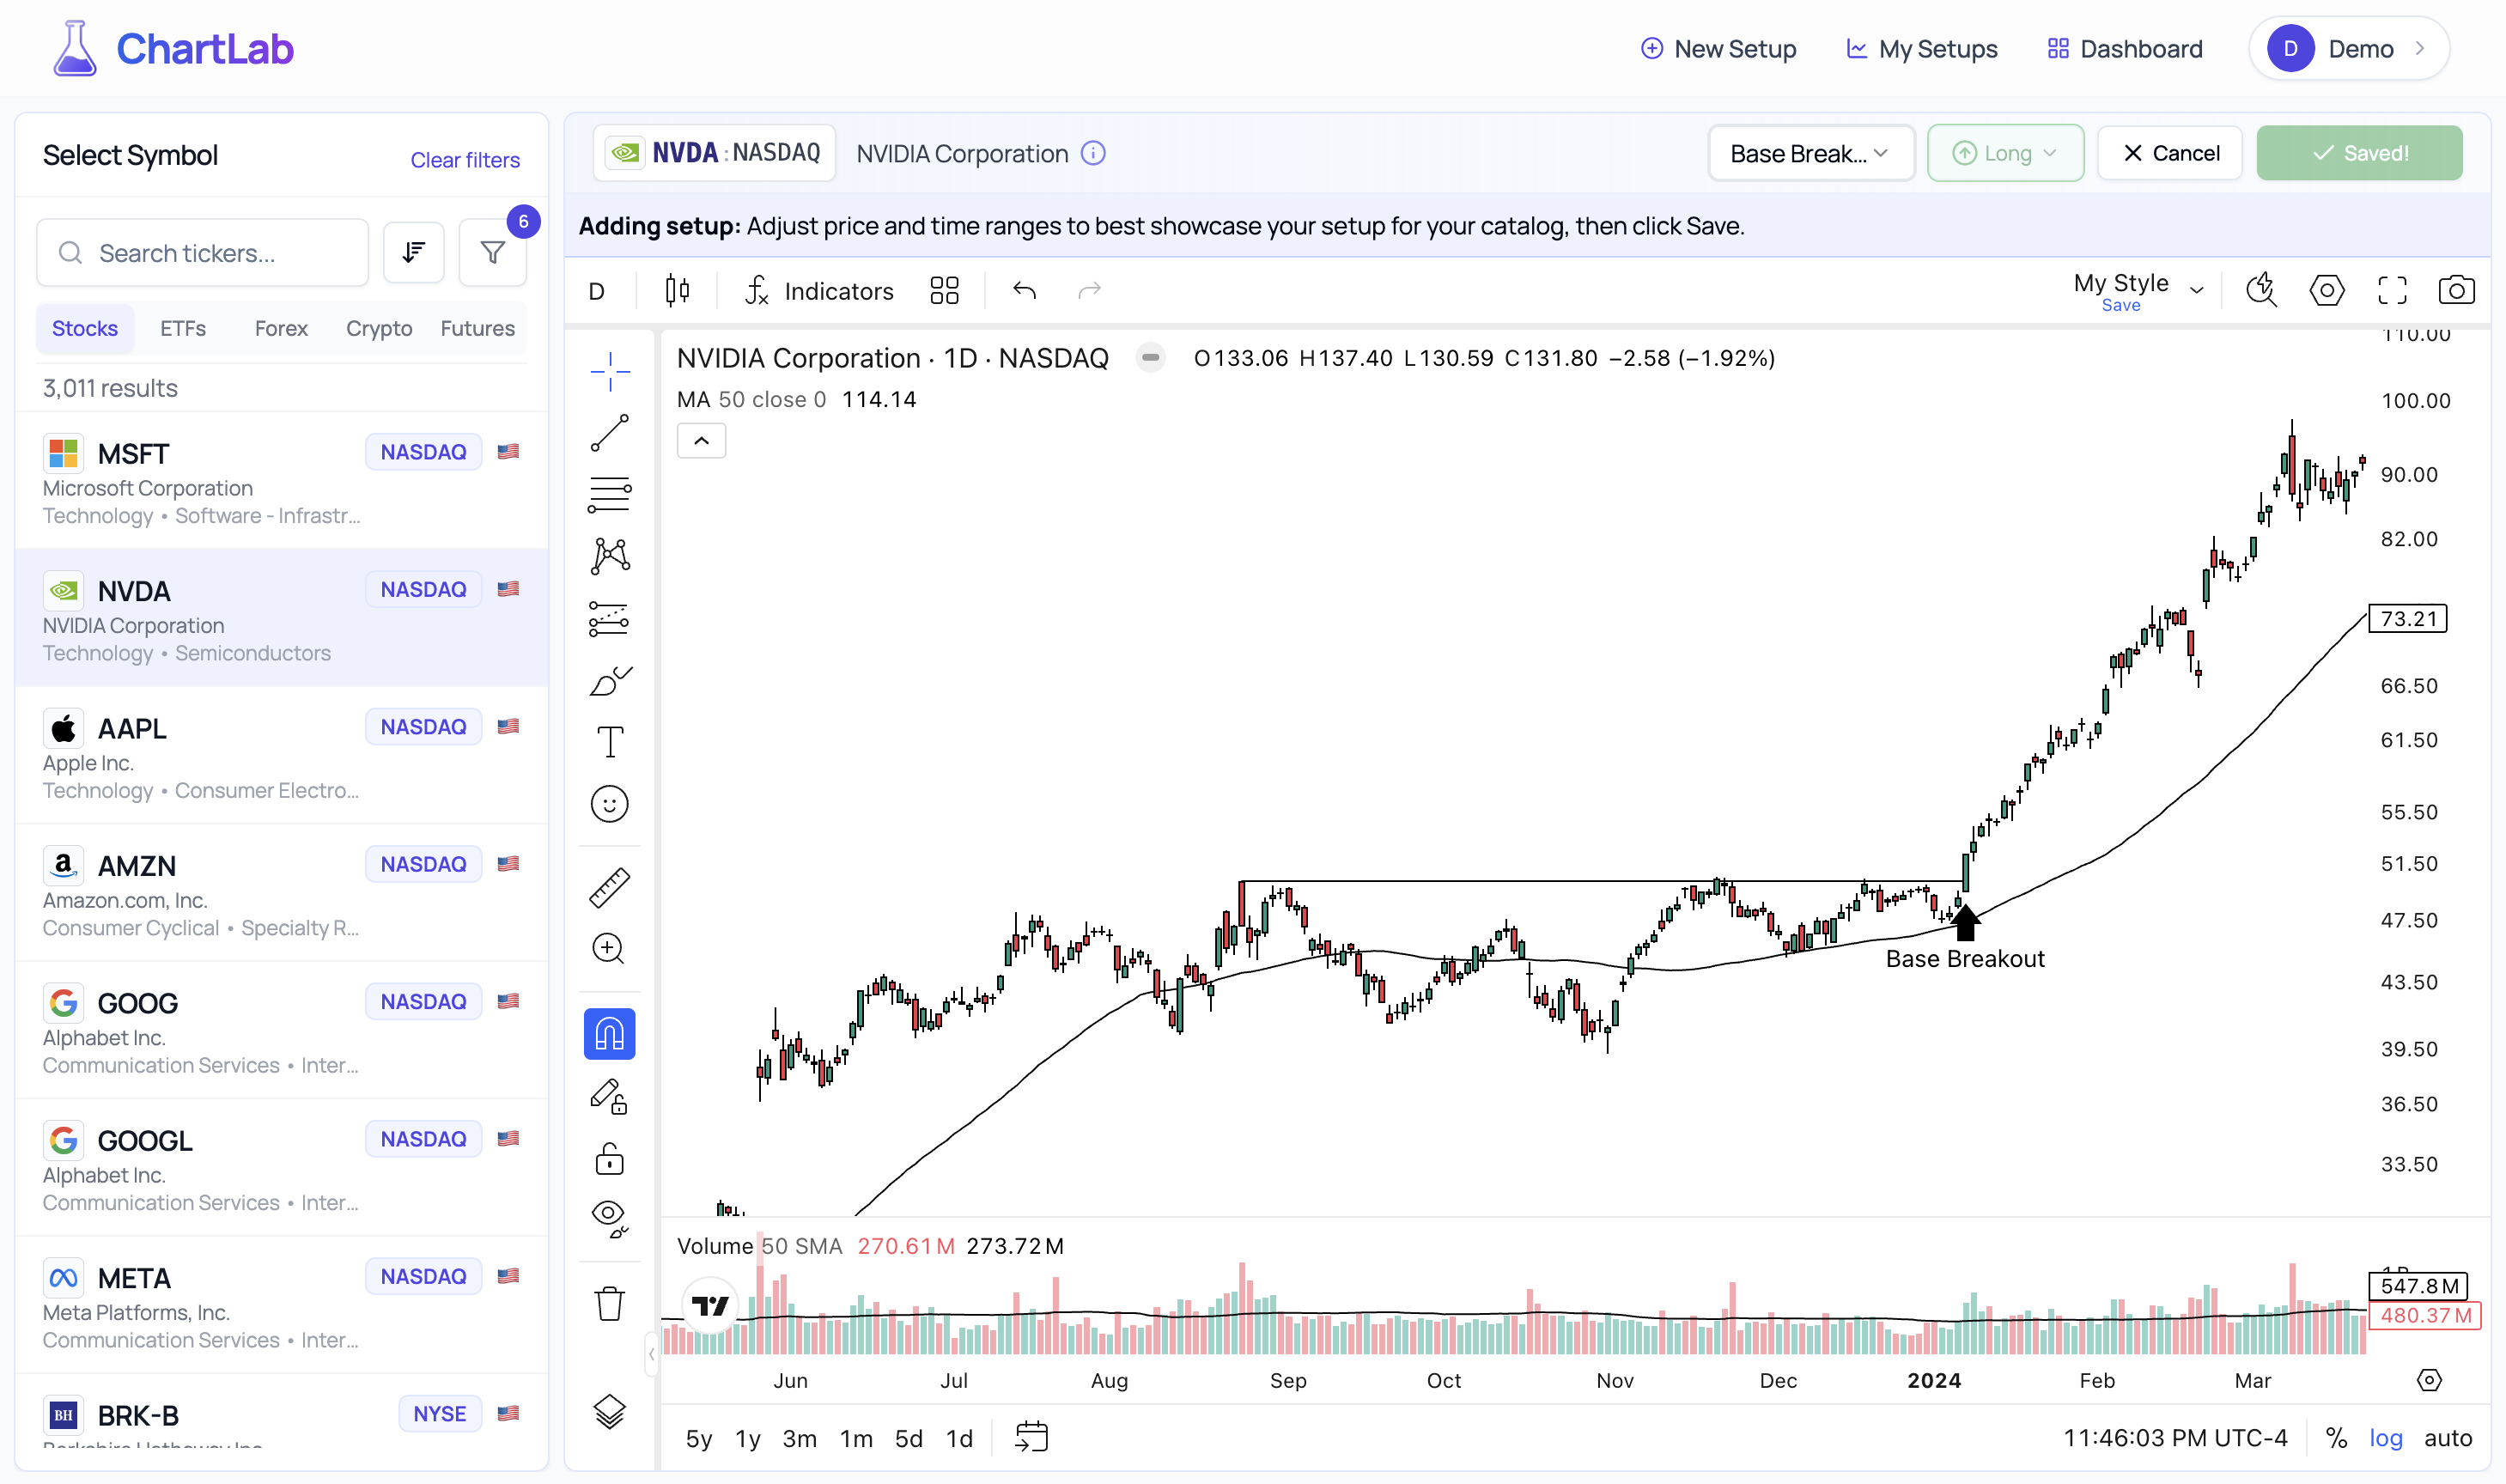
The Setup Documentation Process
Now comes the crucial moment - documenting your trading setup. This is what separates ChartLab from simple screenshot tools.
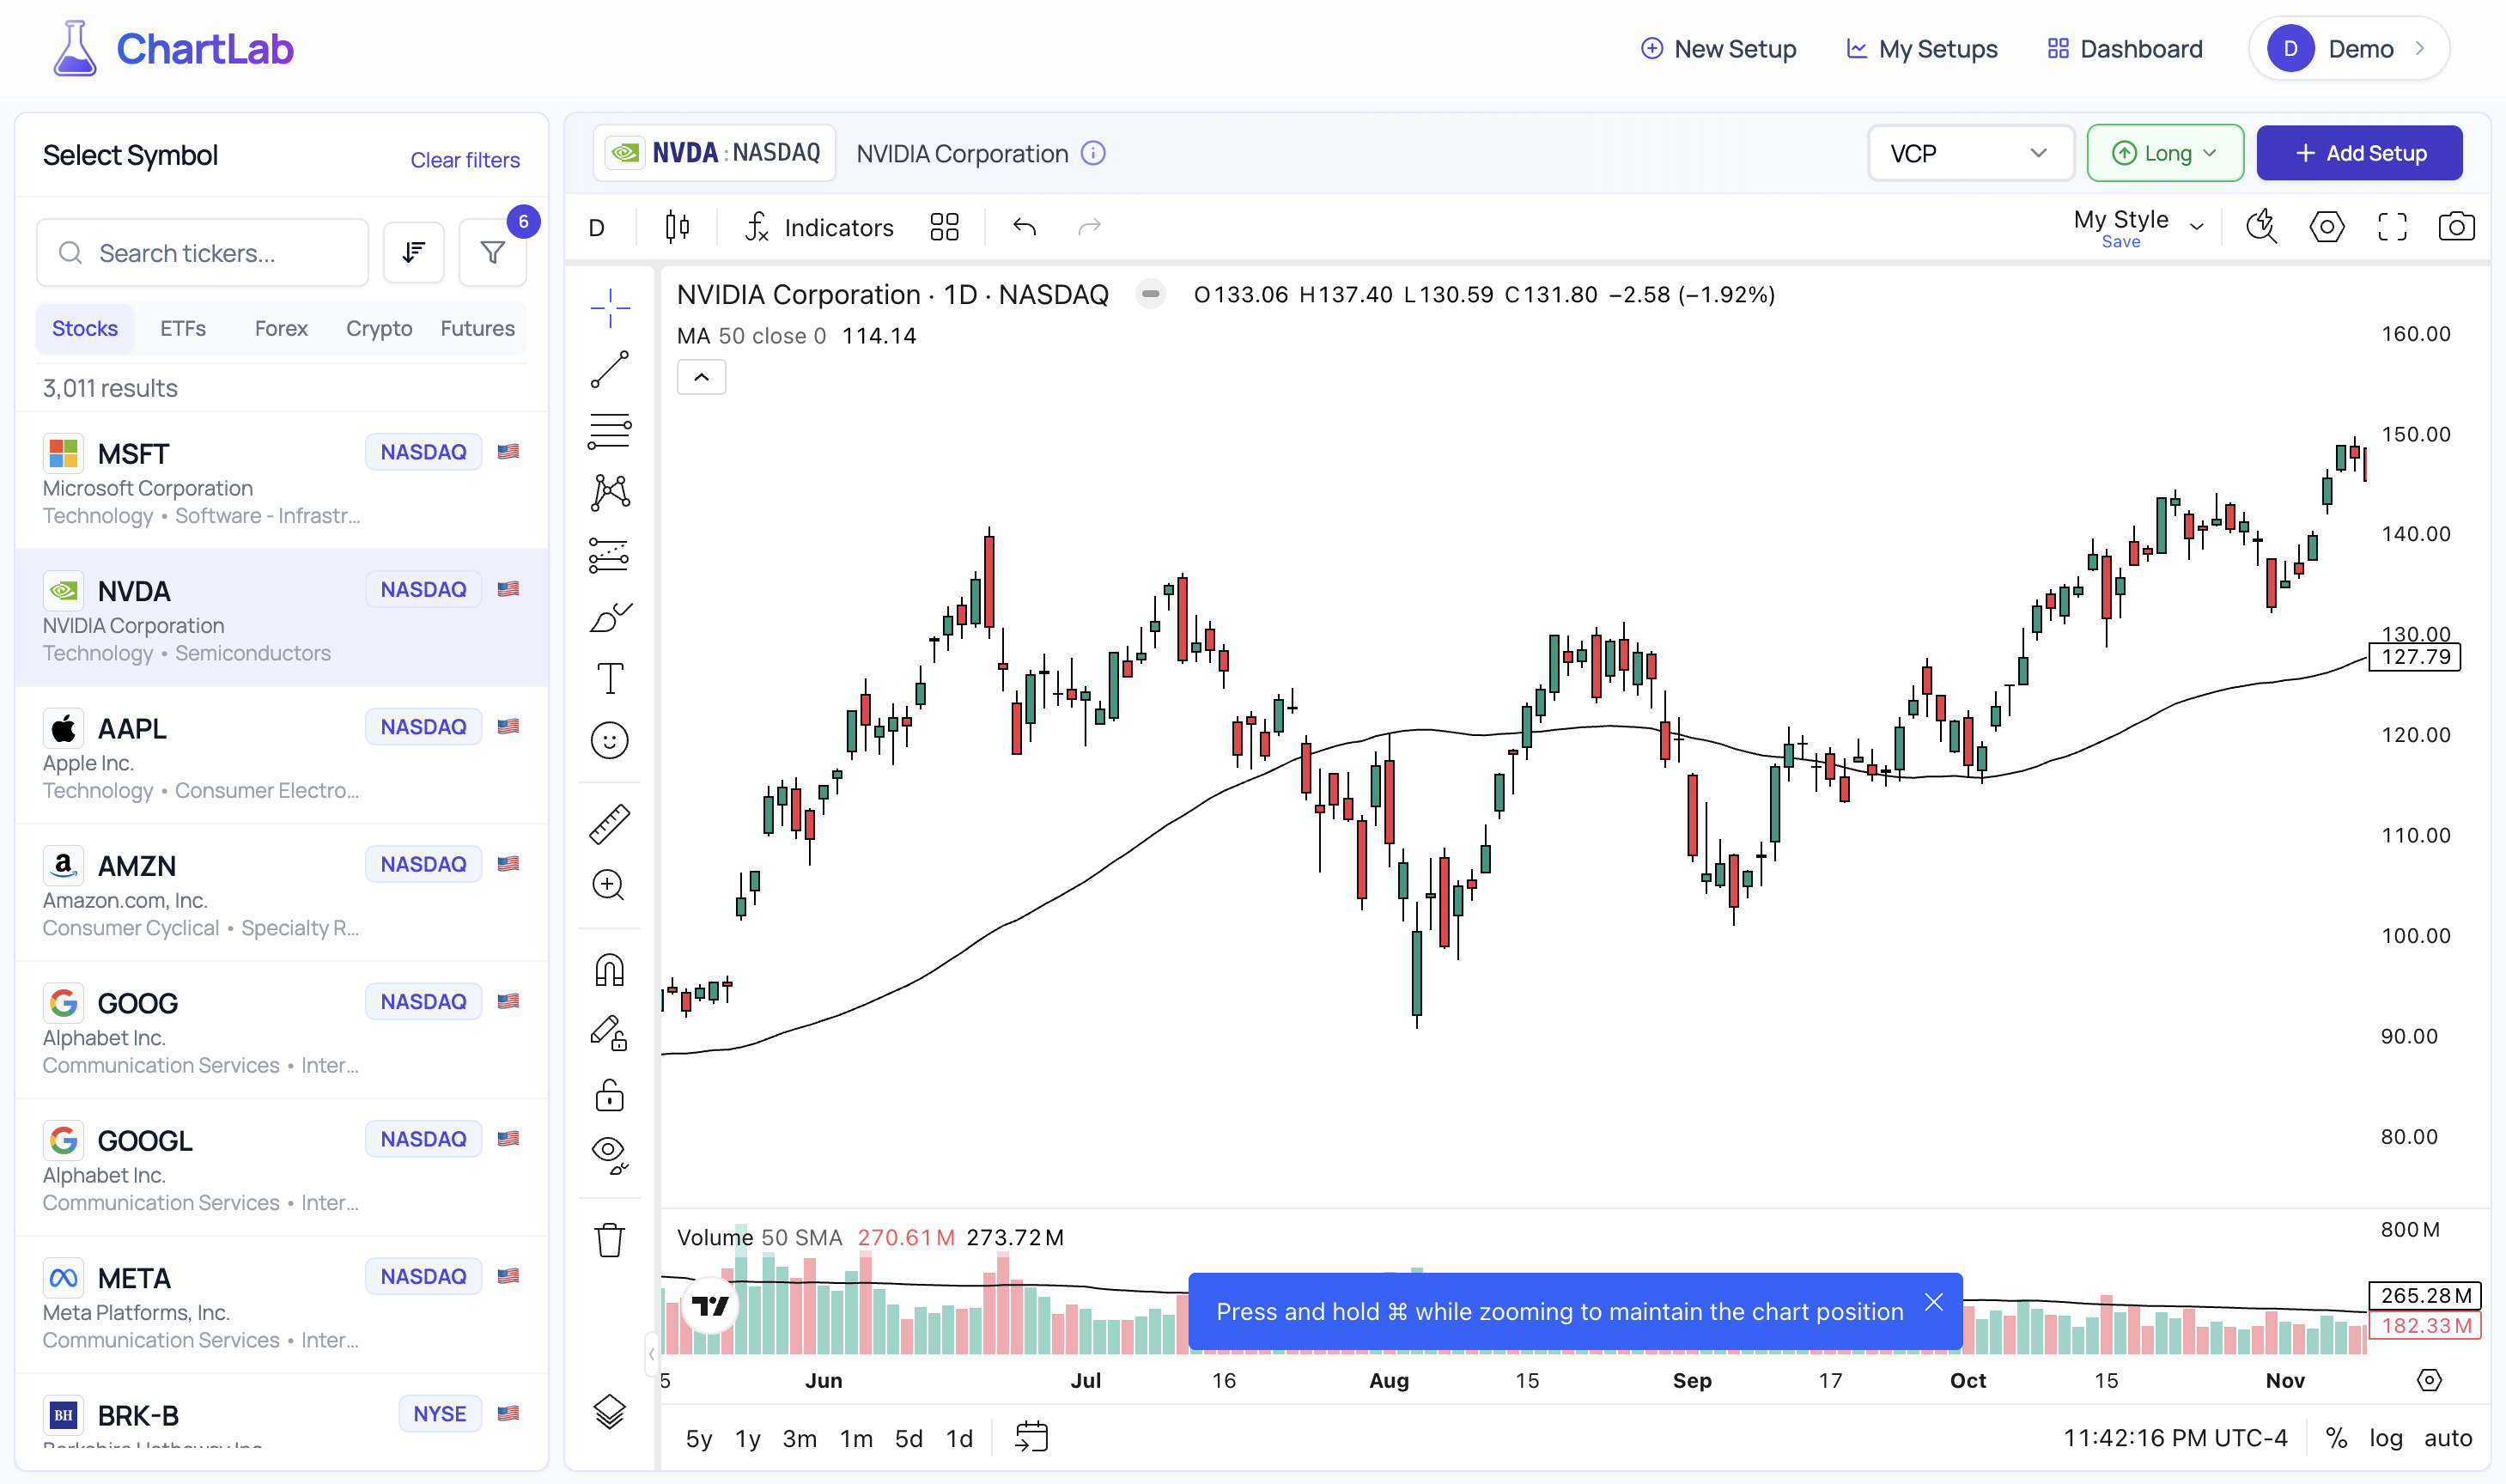
Ready to Add Setup - Pattern selected, chart configured
Mark Your Entry Point
ChartLab's intelligent setup marking system guides you through the process.
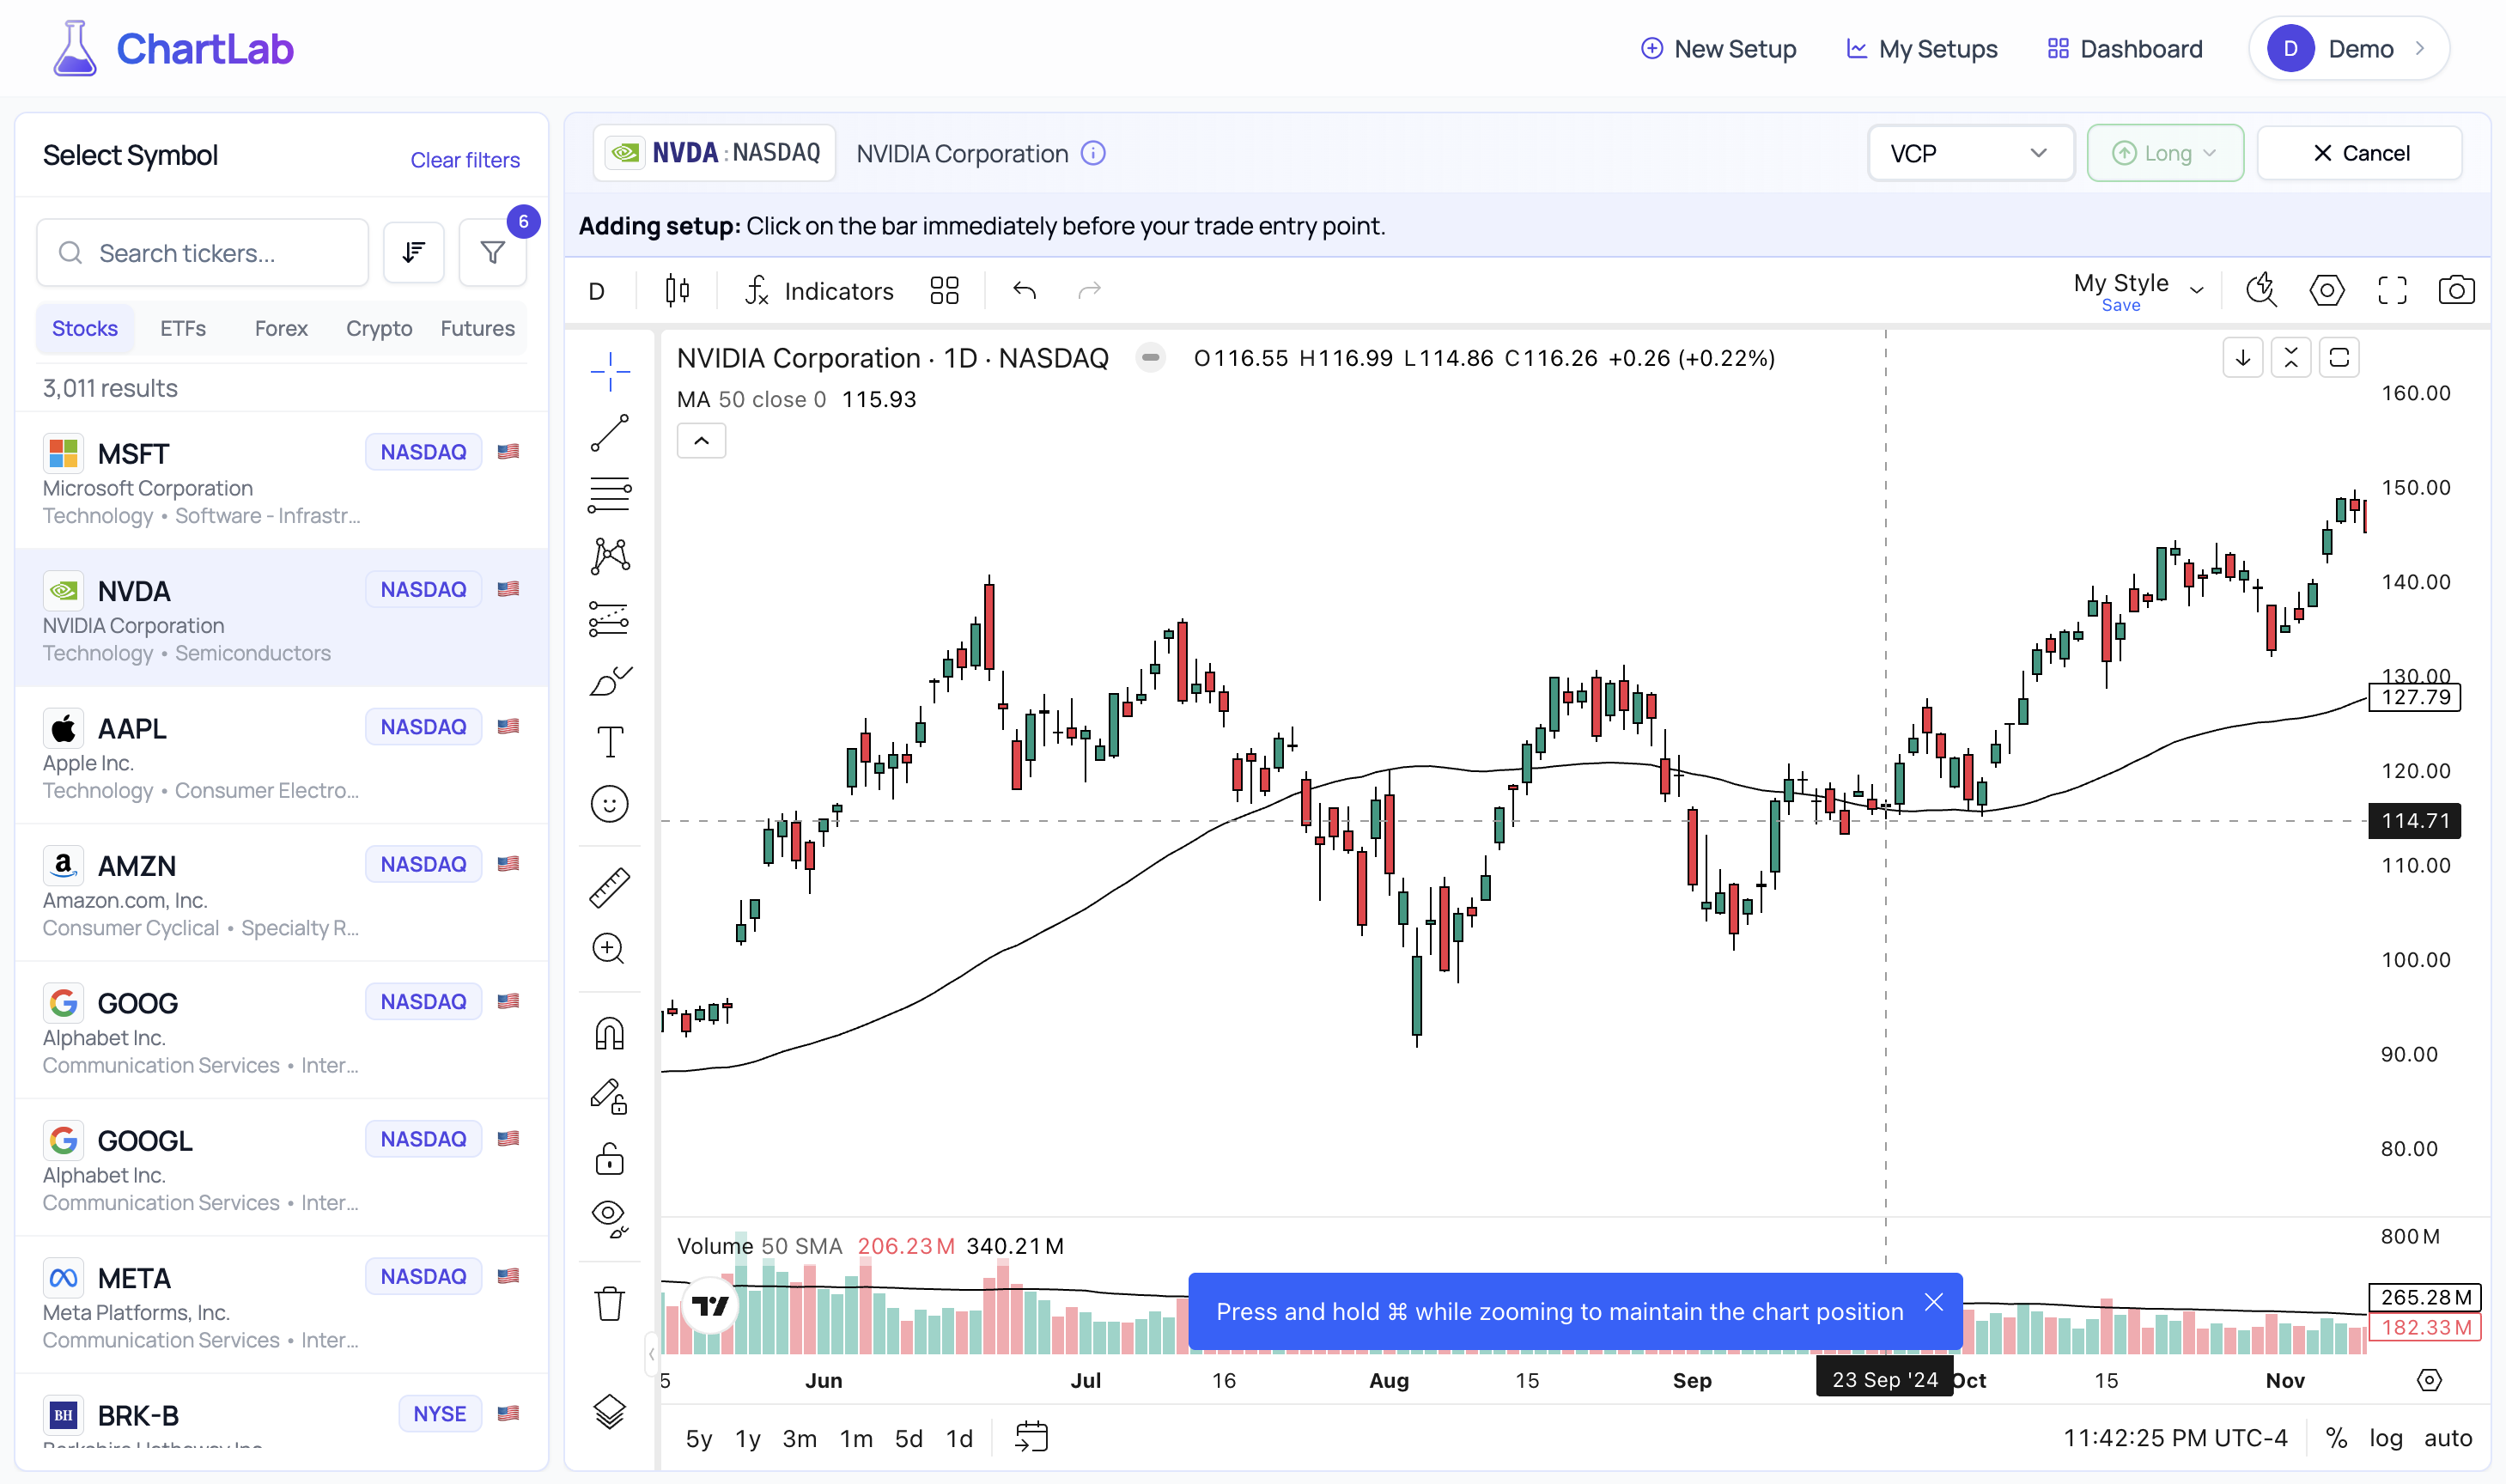
Click Your Entry Point - Precision pattern documentation
Review and Frame Your Setup
After clicking your entry point, ChartLab marks it with an arrow (using your setup type's configured colors).
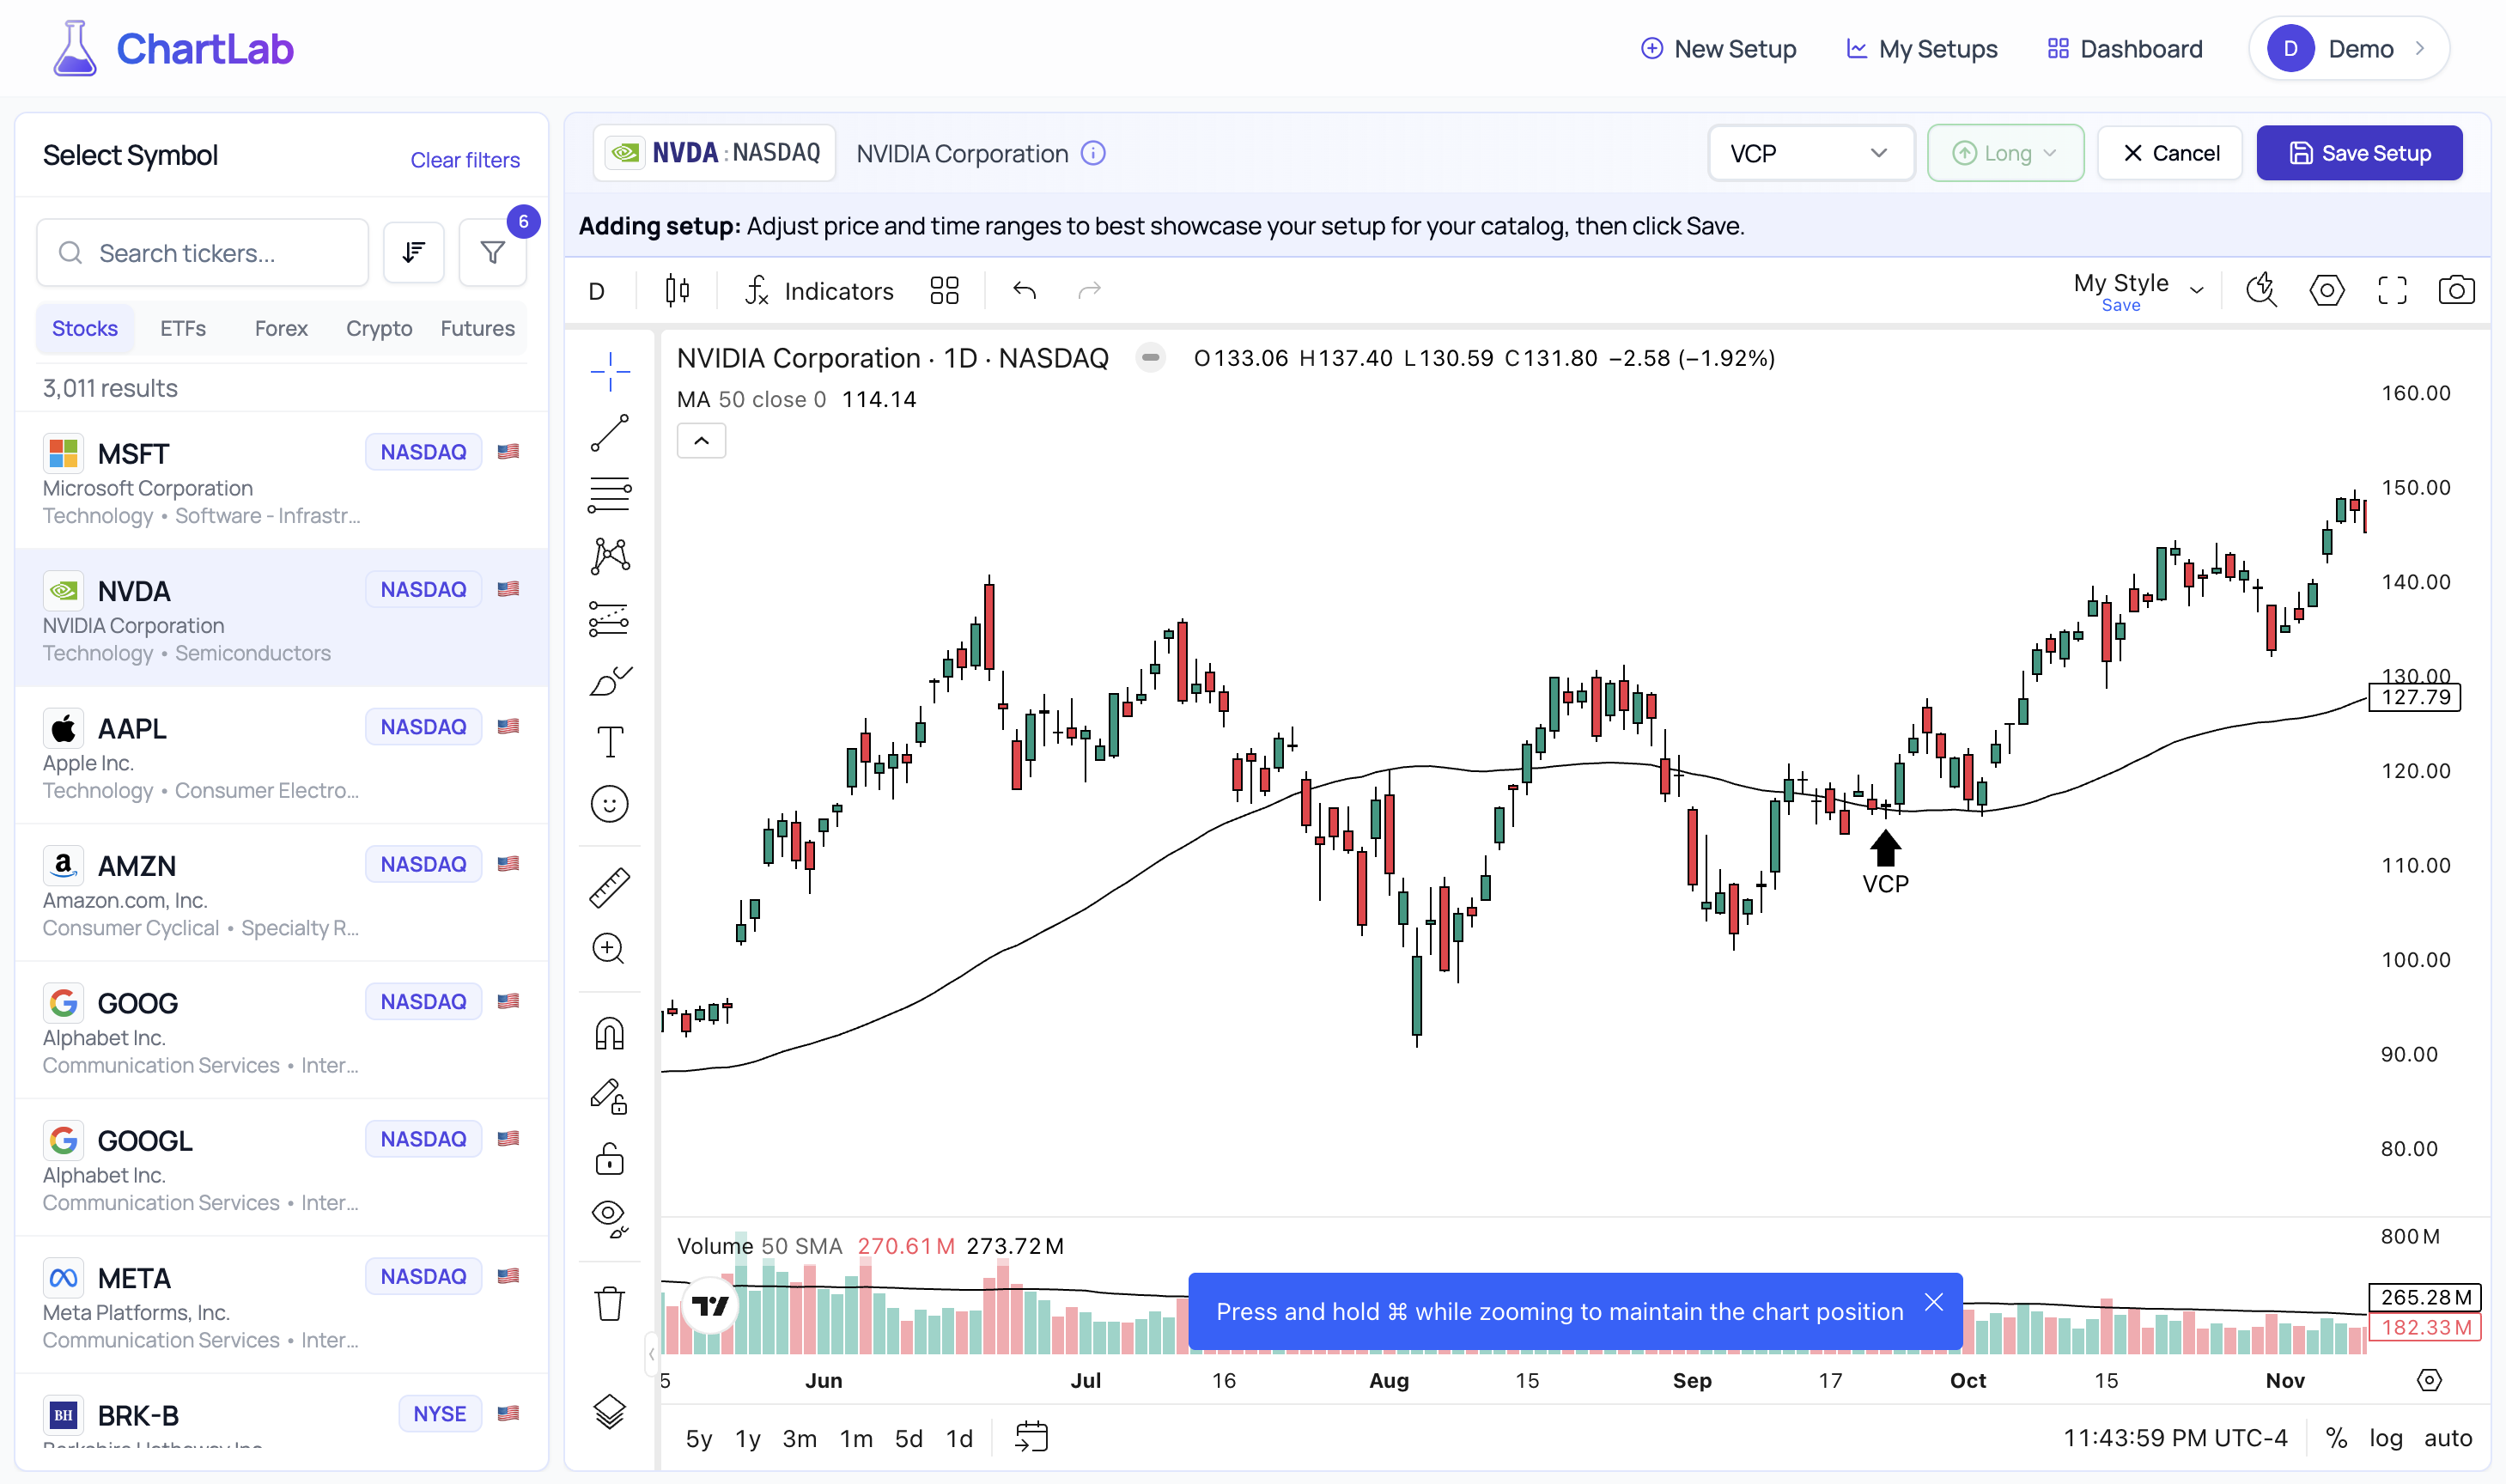
Setup Marked - Ready to save your analysis
Confirmation - Your Setup is Preserved
Click "Save Setup" and your pattern is permanently documented.
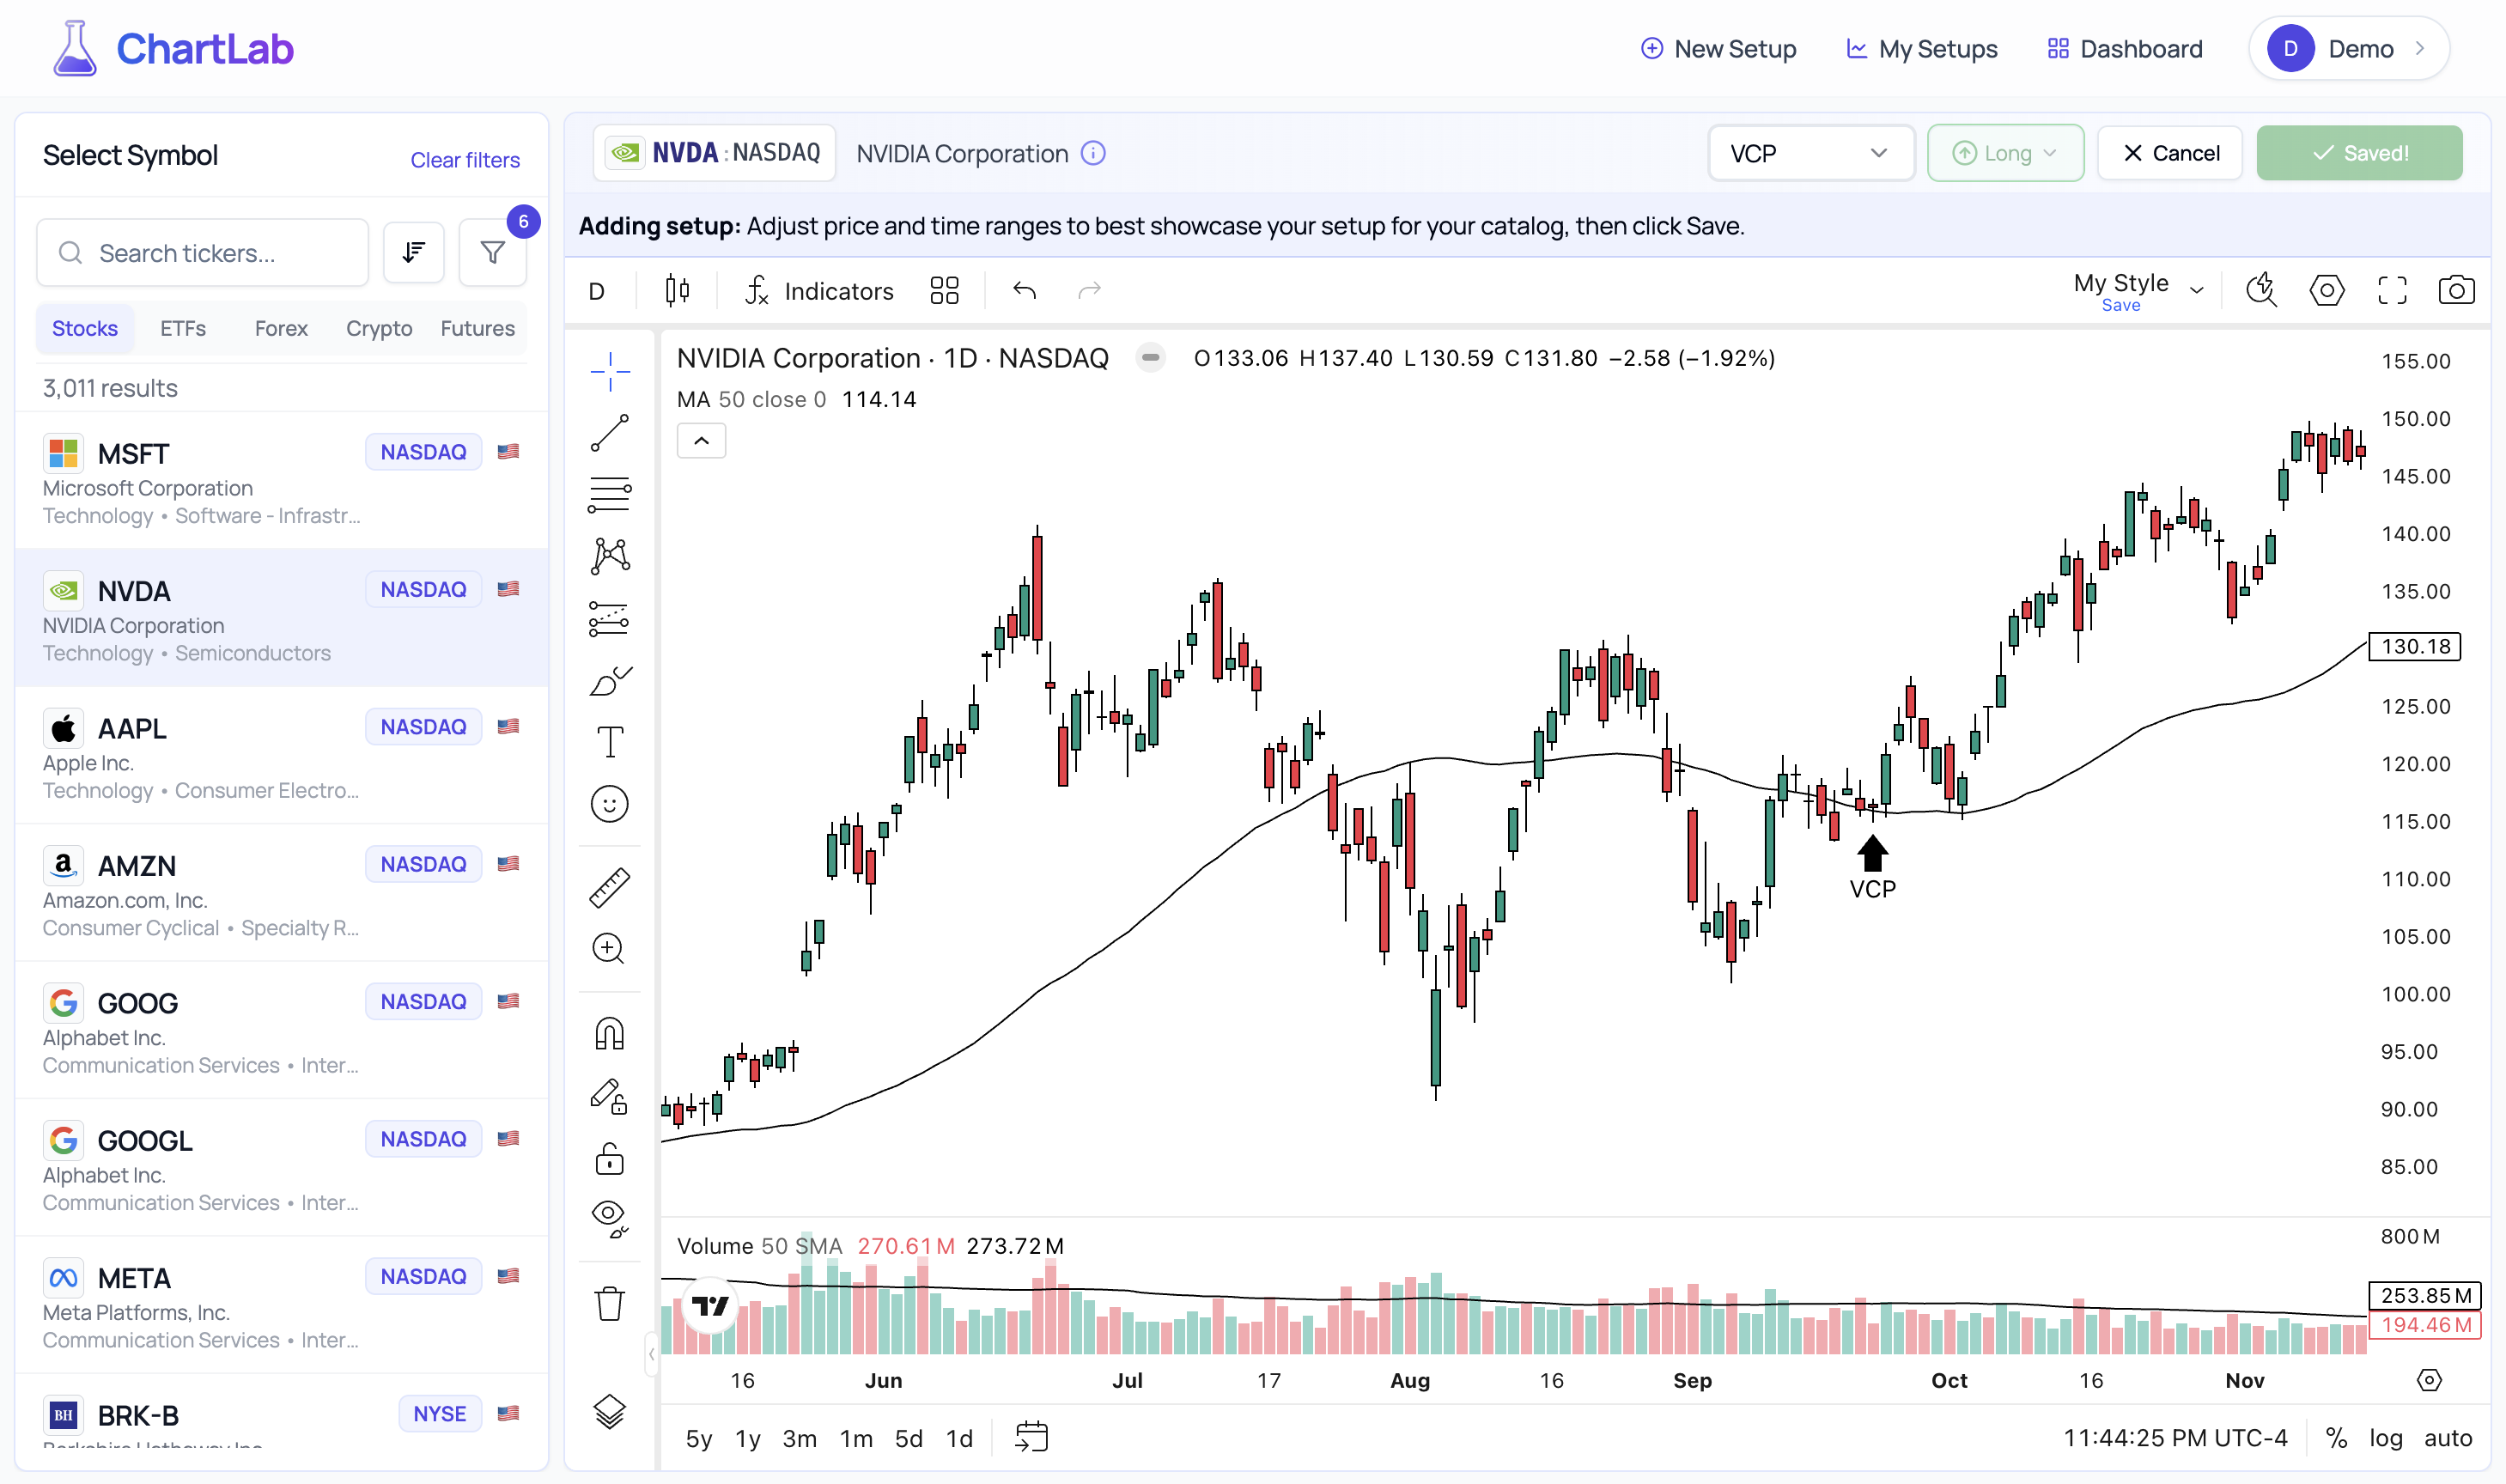
Setup Successfully Saved - Building your pattern library
Document Multiple Pattern Types
The real power of ChartLab emerges when you document the same market situation through different pattern lenses.
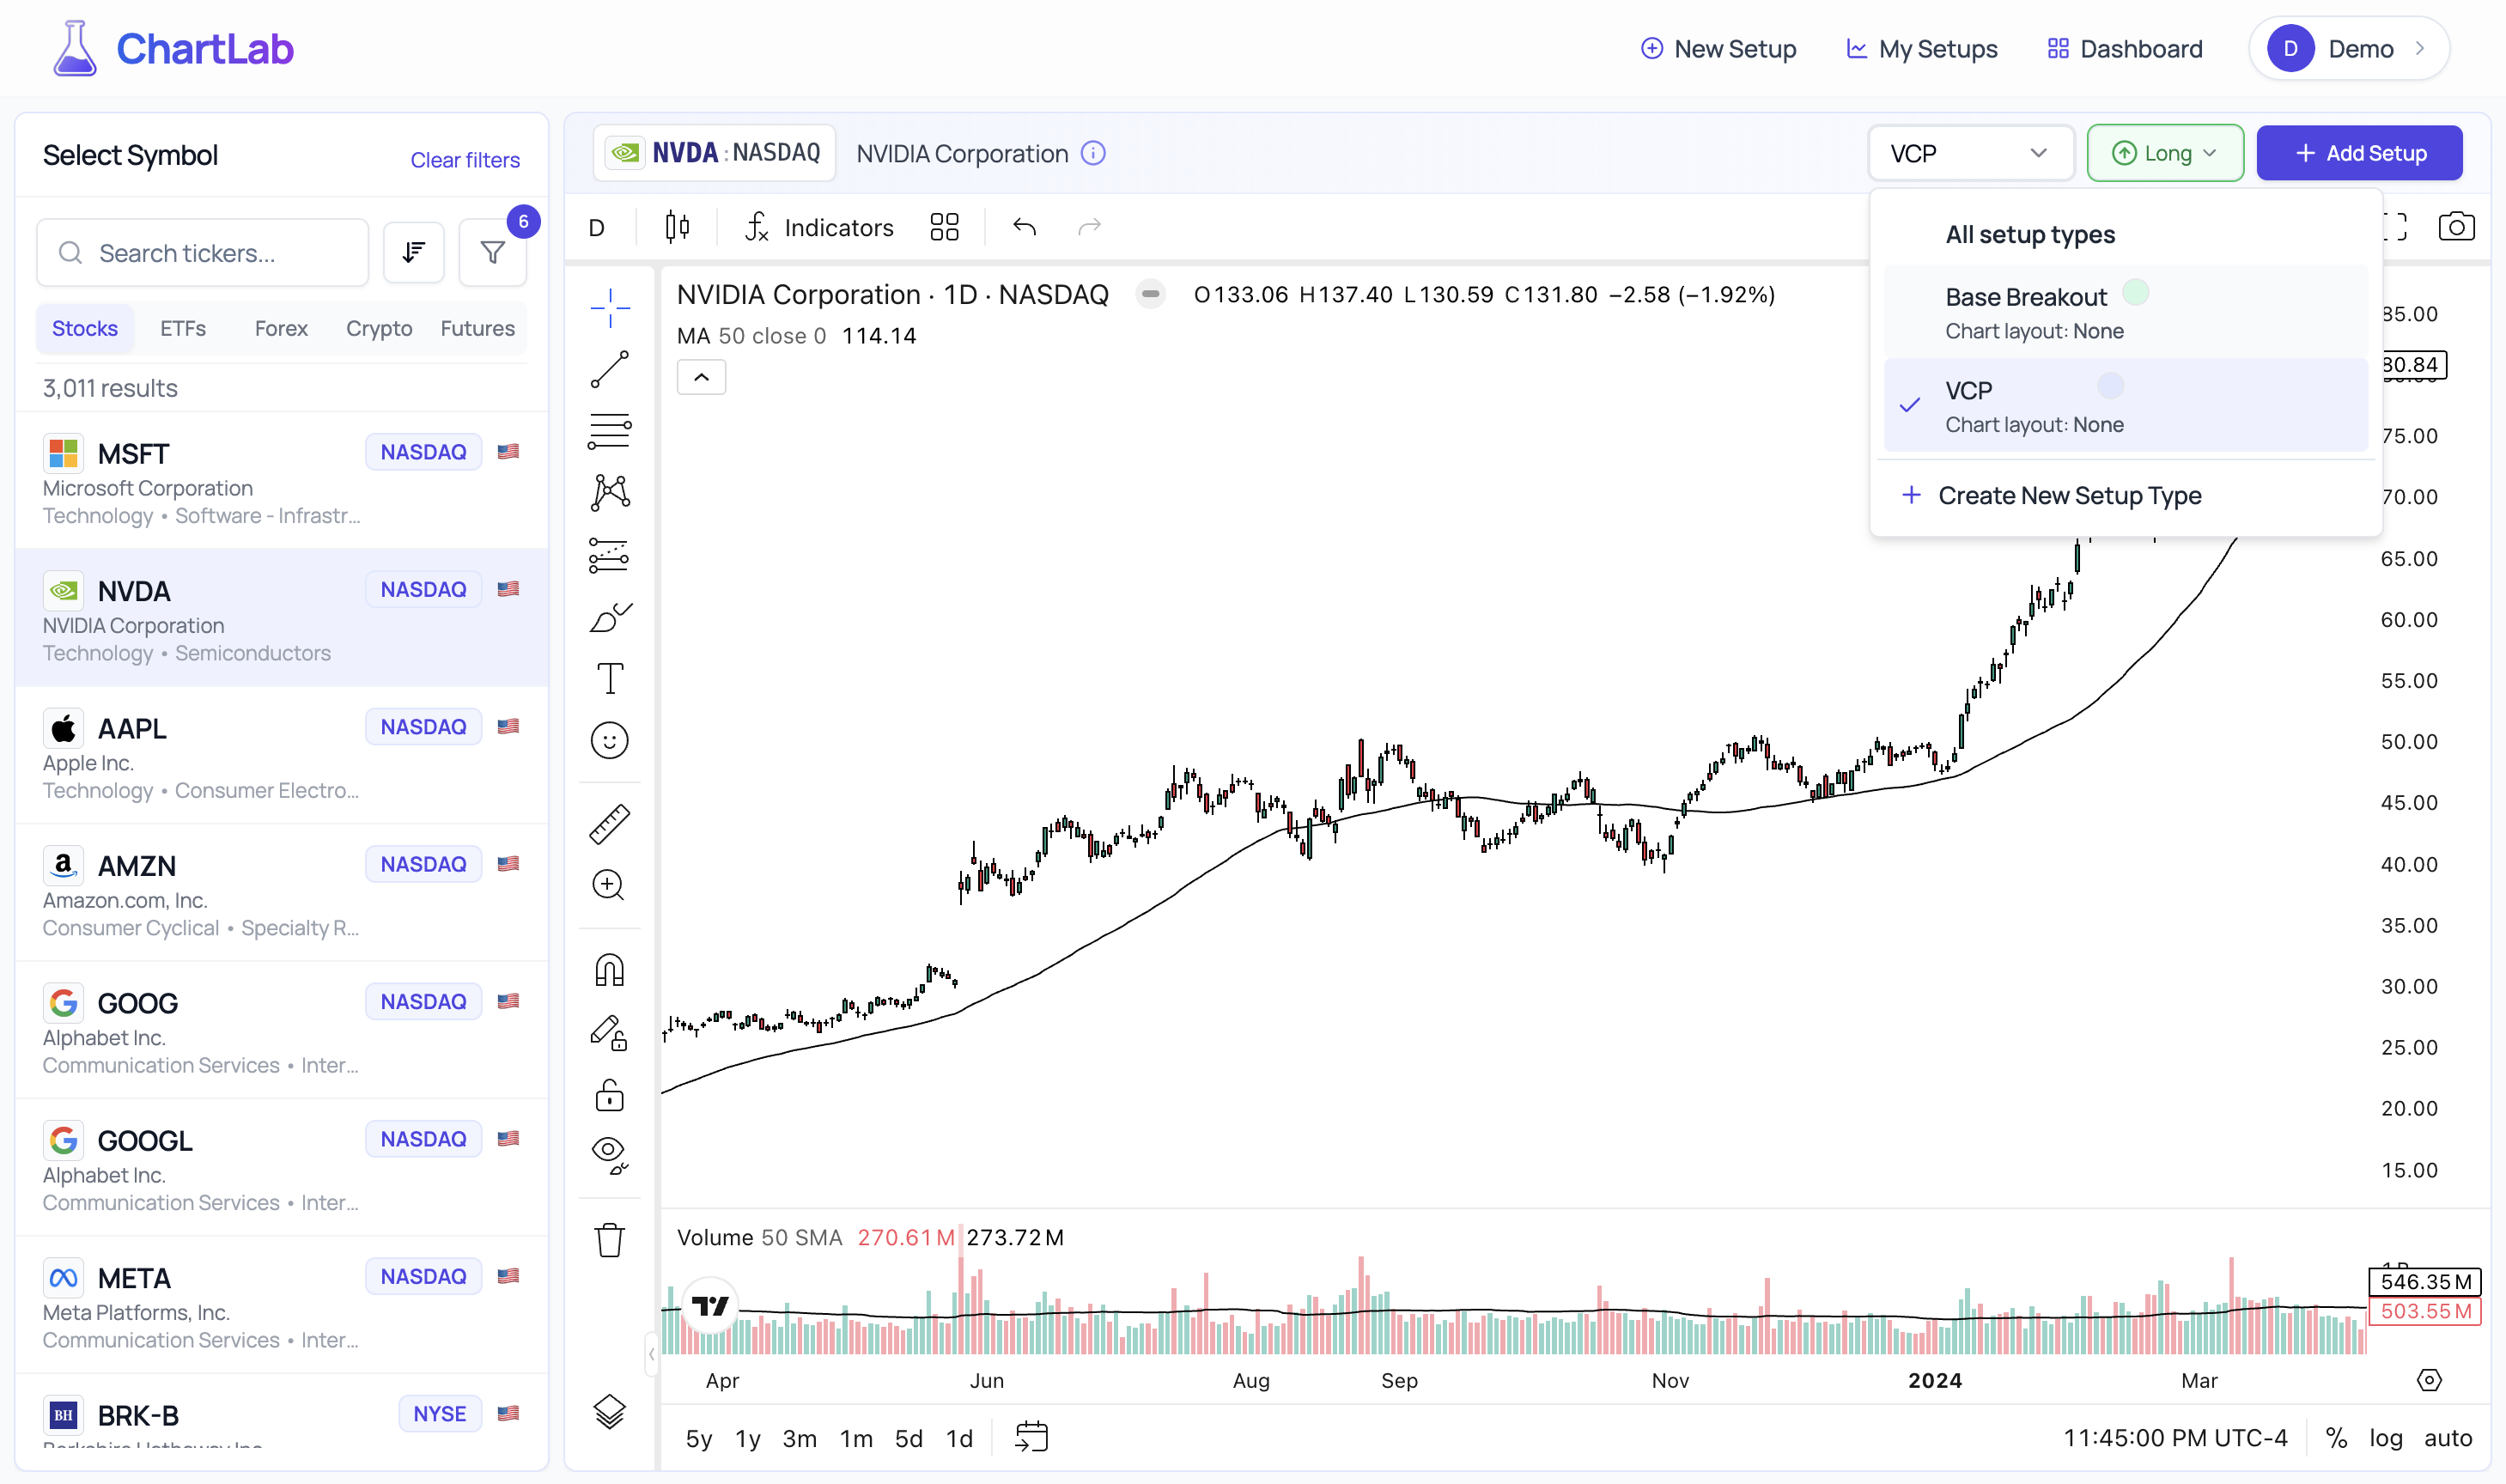
Switch Setup Types - Multiple perspectives on one chart
Adding a Different Pattern
Let's document a Base Breakout pattern on the same chart.
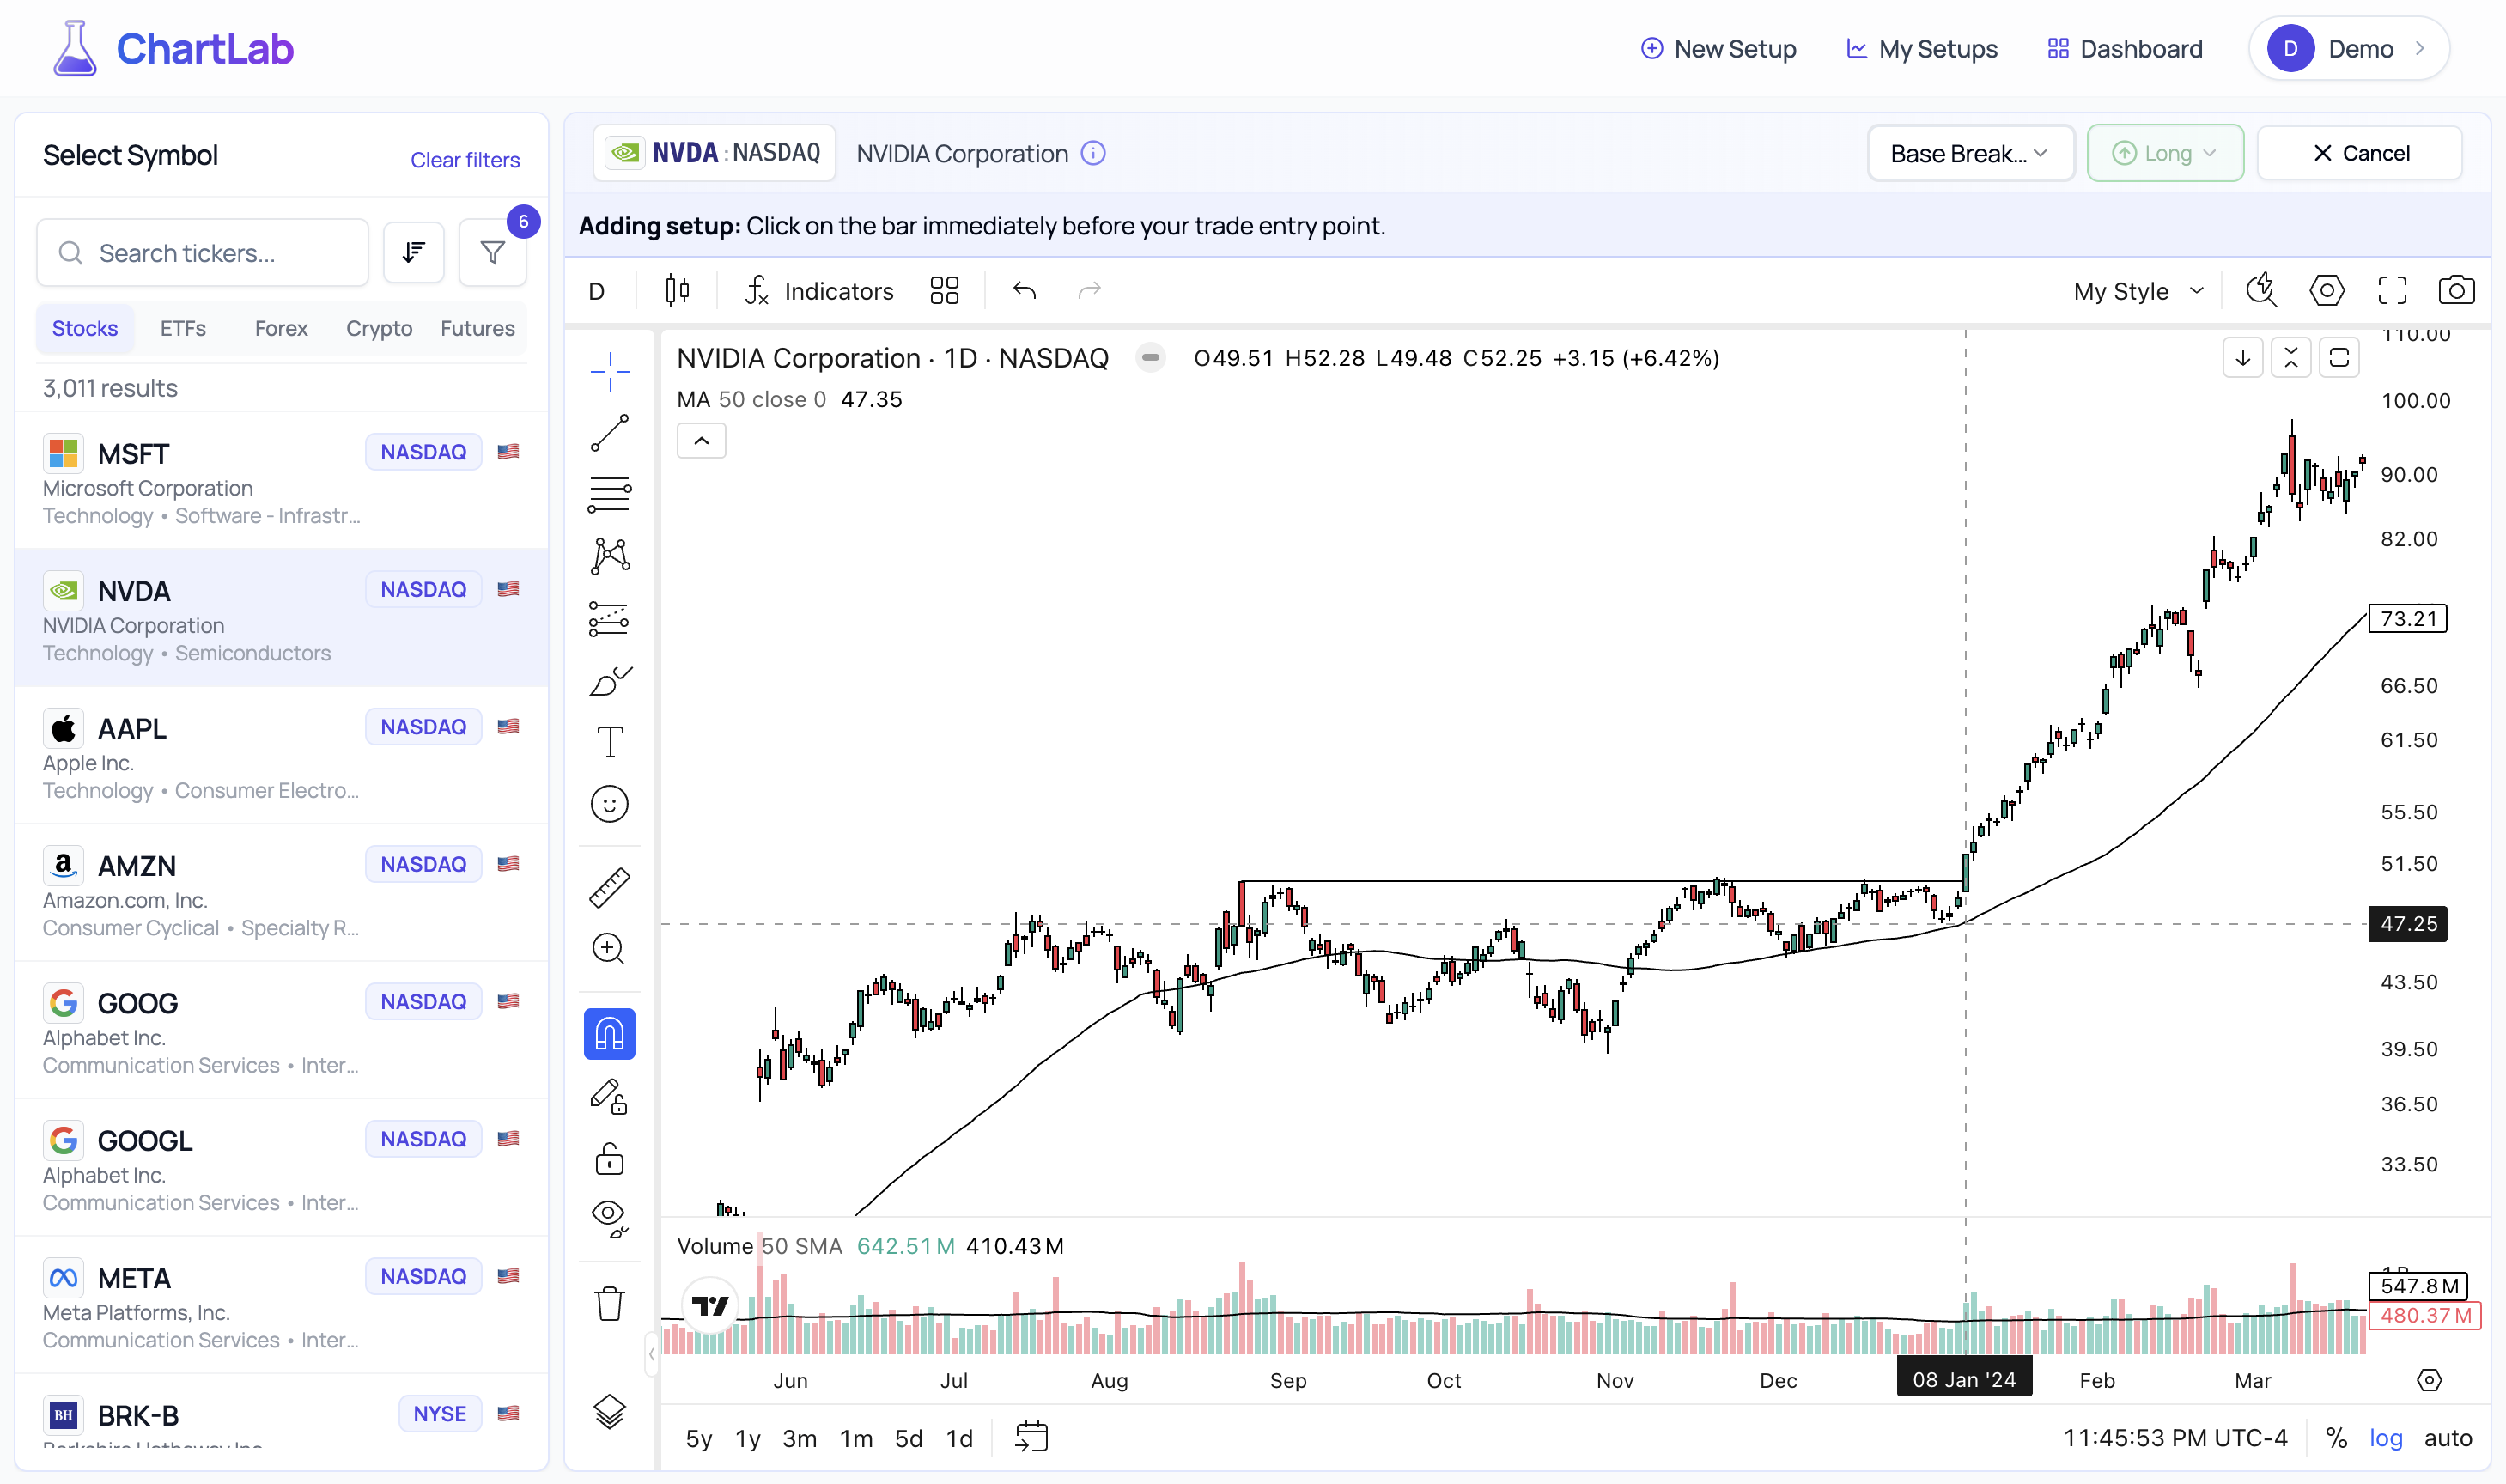
Different Pattern Selected - Base Breakout view
Multiple Patterns Documented
Document as many patterns as you identify, building a comprehensive view of the opportunity.
Second Pattern Saved - Comprehensive analysis
Pro Tips for Setup Documentation:
- • Be Consistent: Click the entry bar where you would actually place your order
- • Frame Thoughtfully: Zoom out enough to show the pattern's context but not so far that details are lost
- • Multiple Timeframes: Save the same setup on different timeframes to study multi-timeframe alignment
- • Use Indicators: Add the indicators that confirm your pattern - they're saved with the setup
- • Think in Series: Document multiple examples of each pattern type to build pattern recognition
Organize and Tag Your Setups - Your Visual Trading Journal
Return to your dashboard and navigate to the Catalog. This is where your documented setups come to life, forming a powerful, visual trading journal. It's more than just a list; it's your personalized library of market behavior, ready for deep analysis.
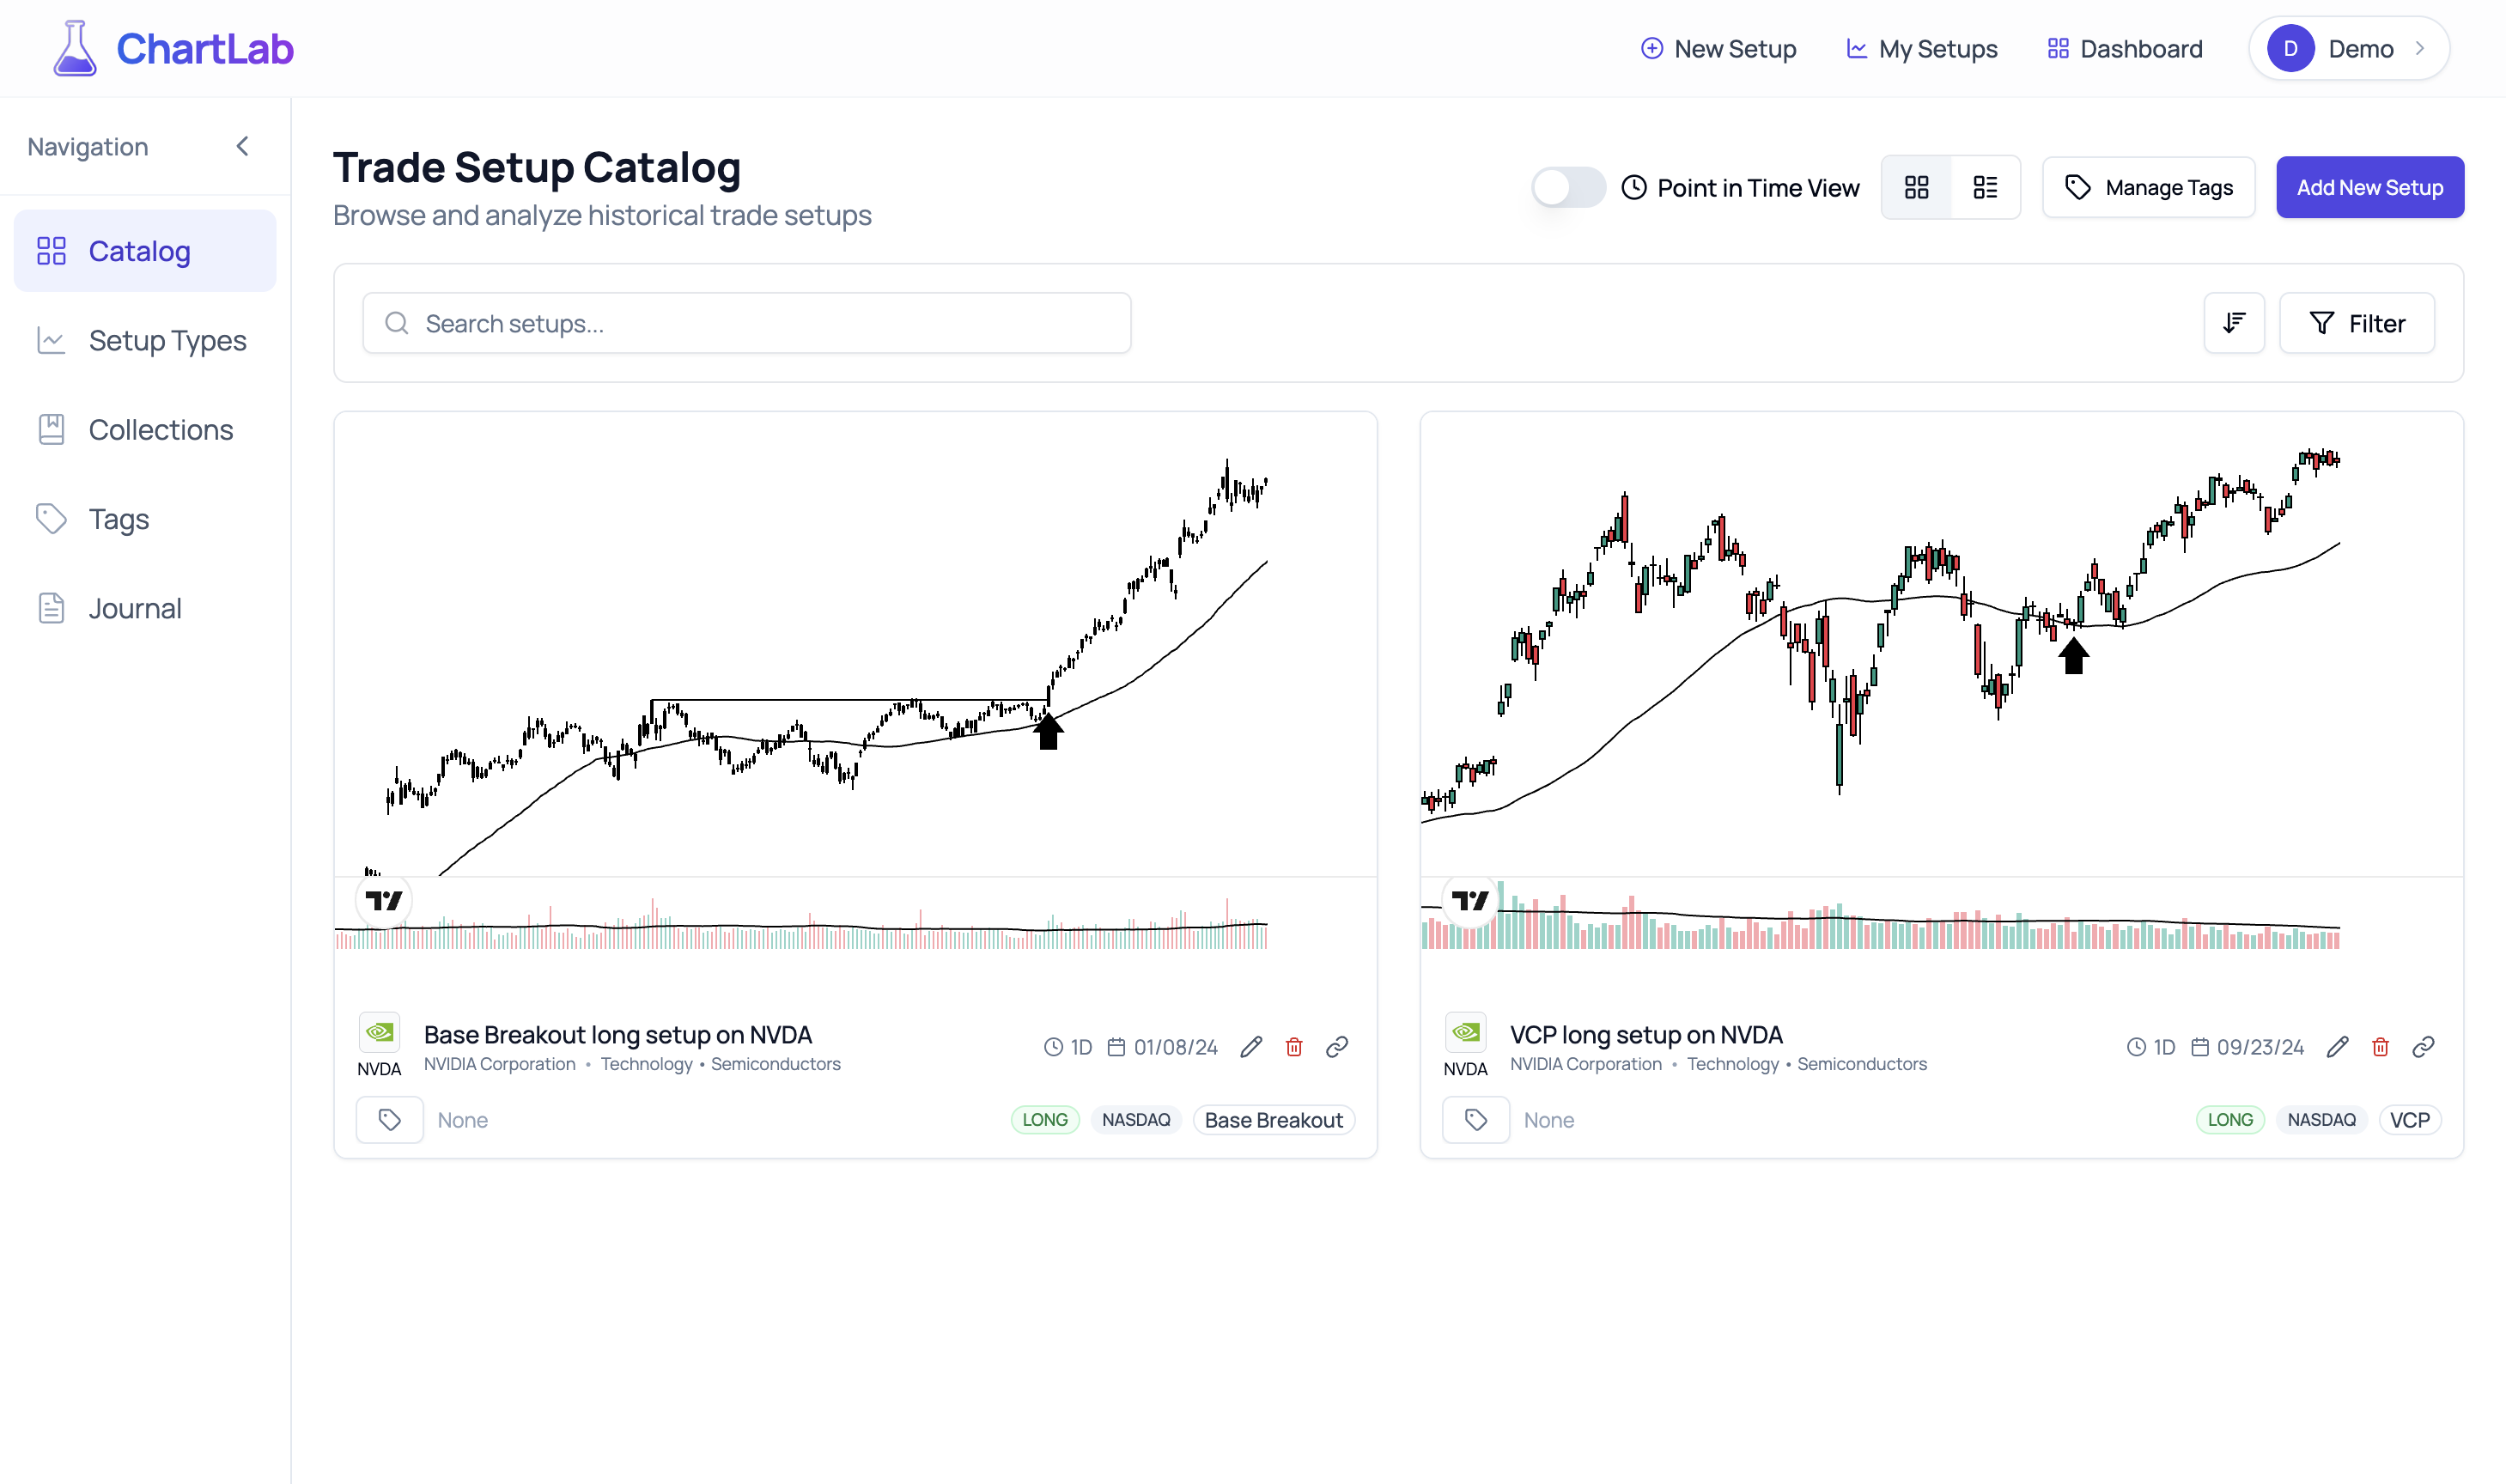
Catalog View - Your Growing Collection of Trading Setups
Applying Tags - Unlock Deeper Insights
Your tagging system, initially created for setup types, now extends its power to individual setups. This granular tagging allows you to categorize and analyze patterns with incredible precision.
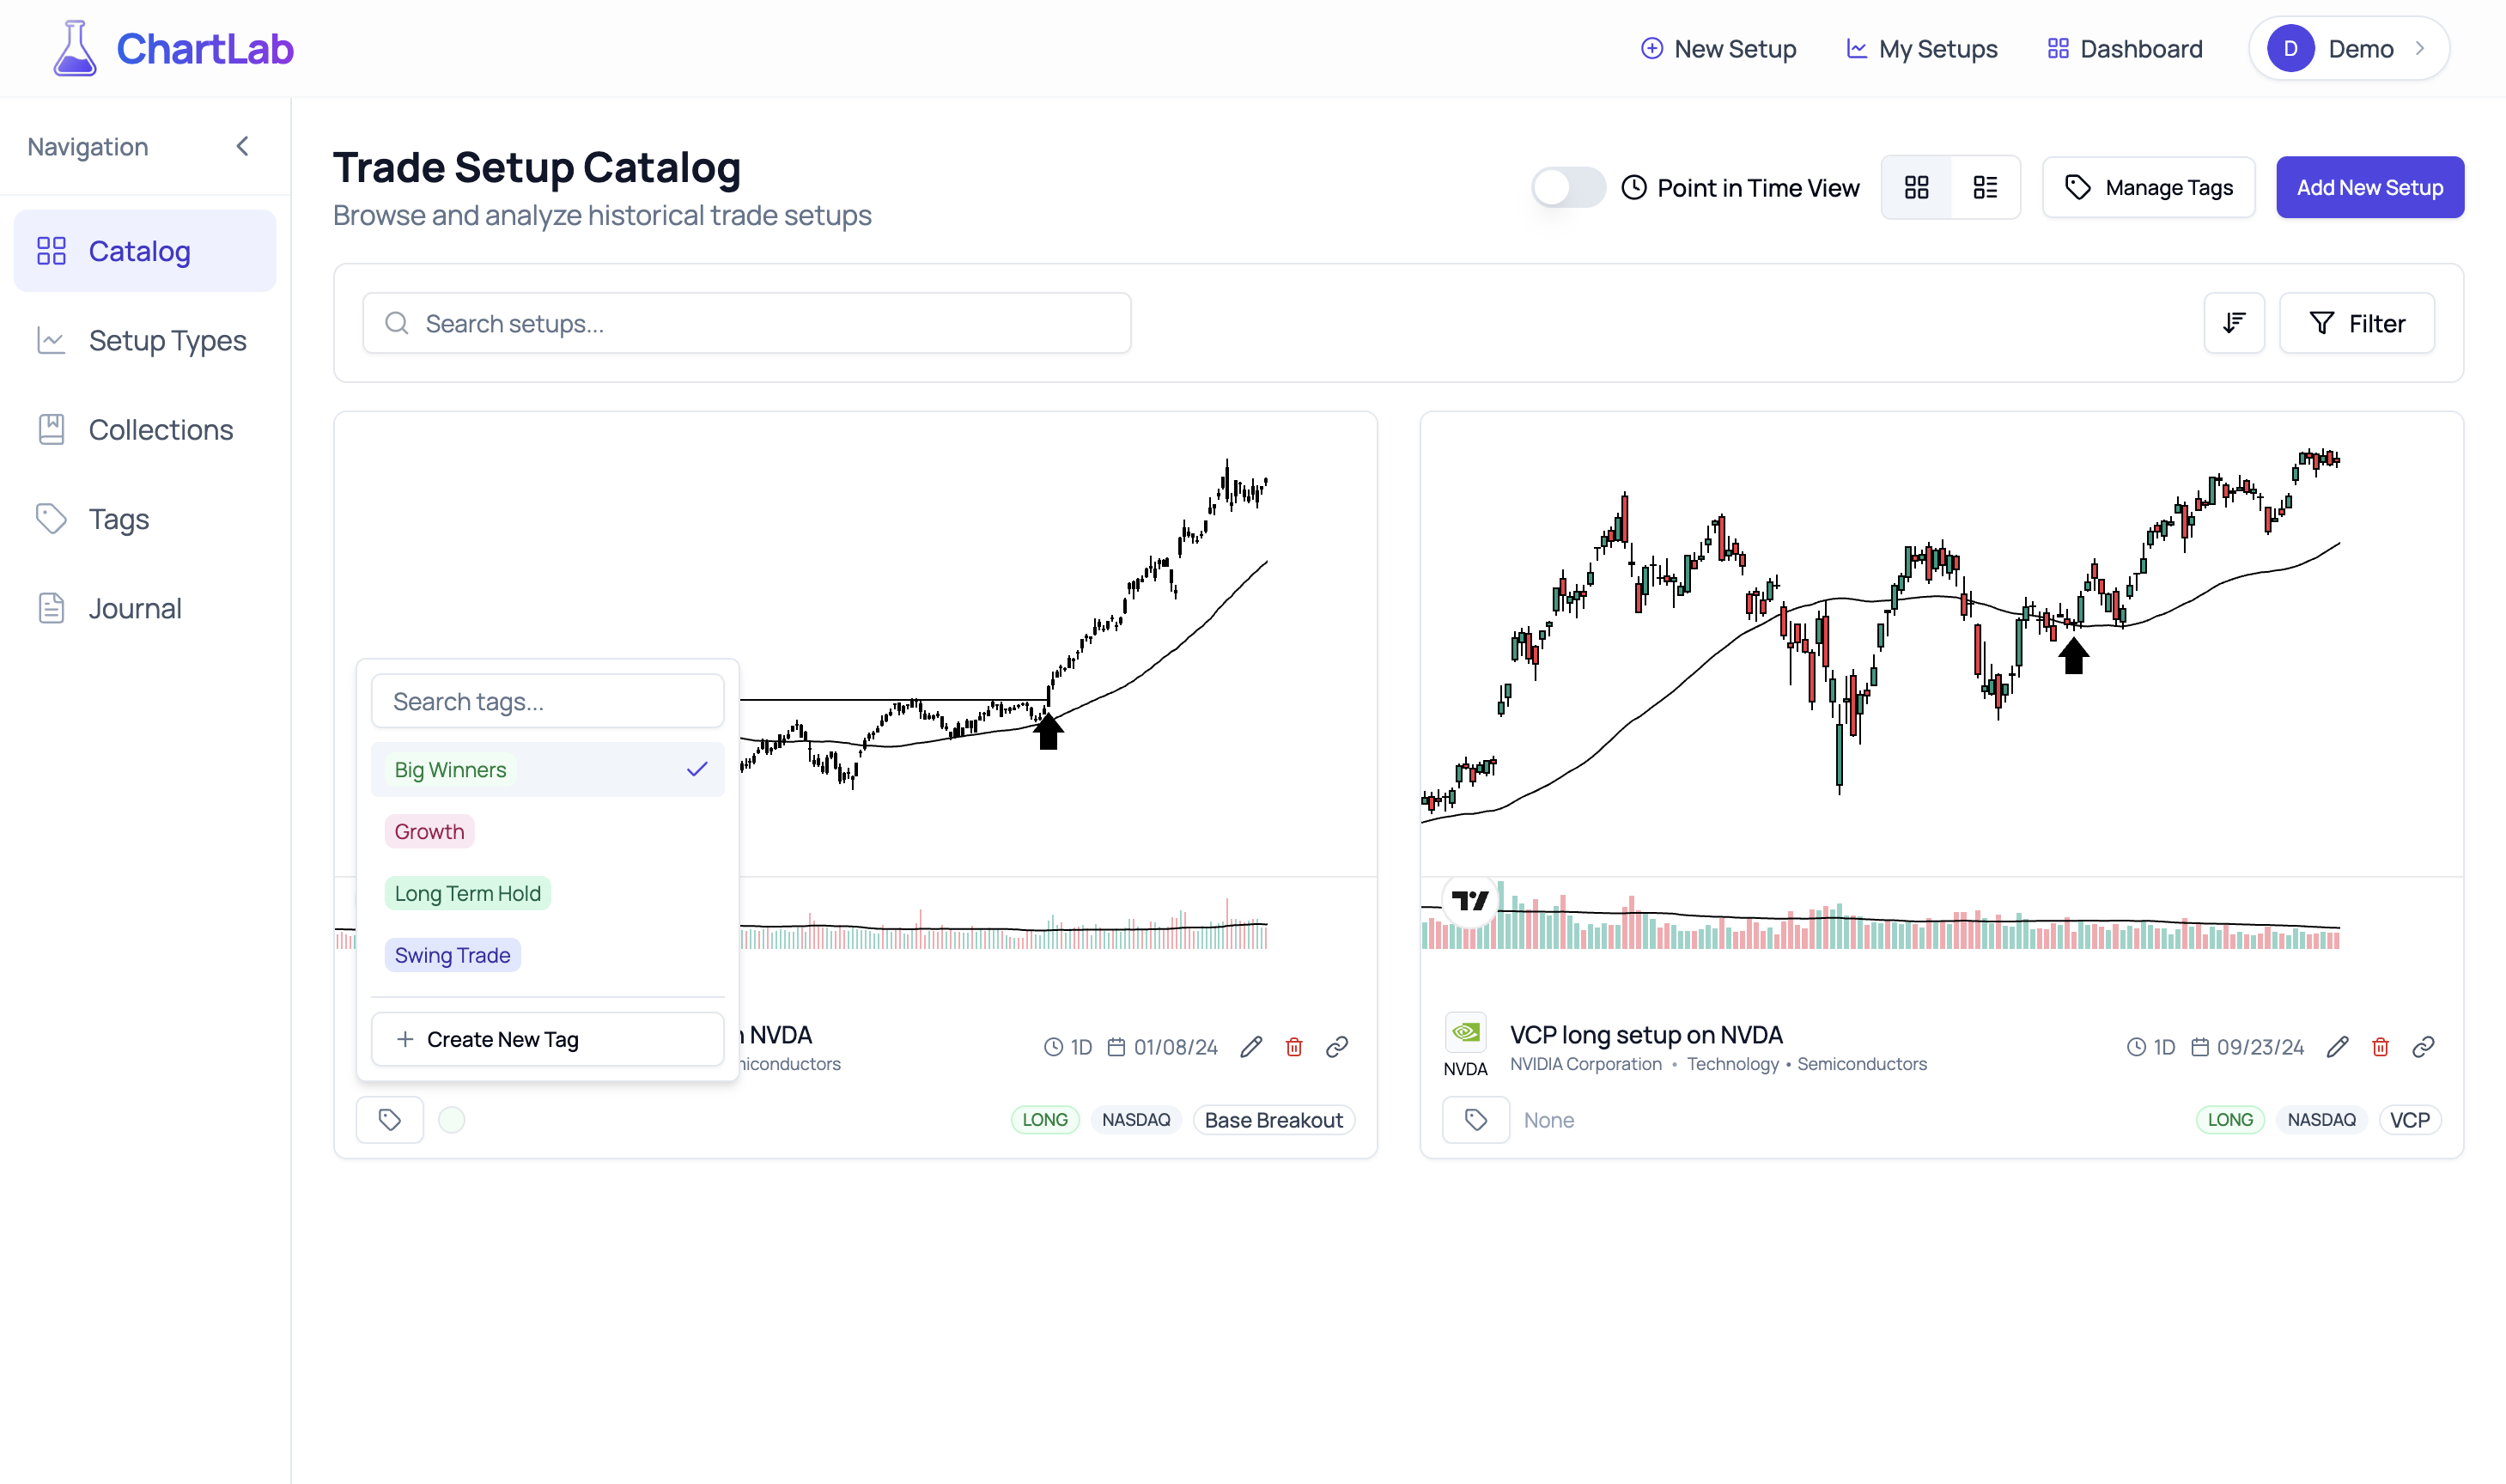
Adding Tags to Setups - Contextual Organization
Once tags are applied, they provide immediate visual cues and powerful filtering capabilities within your catalog.
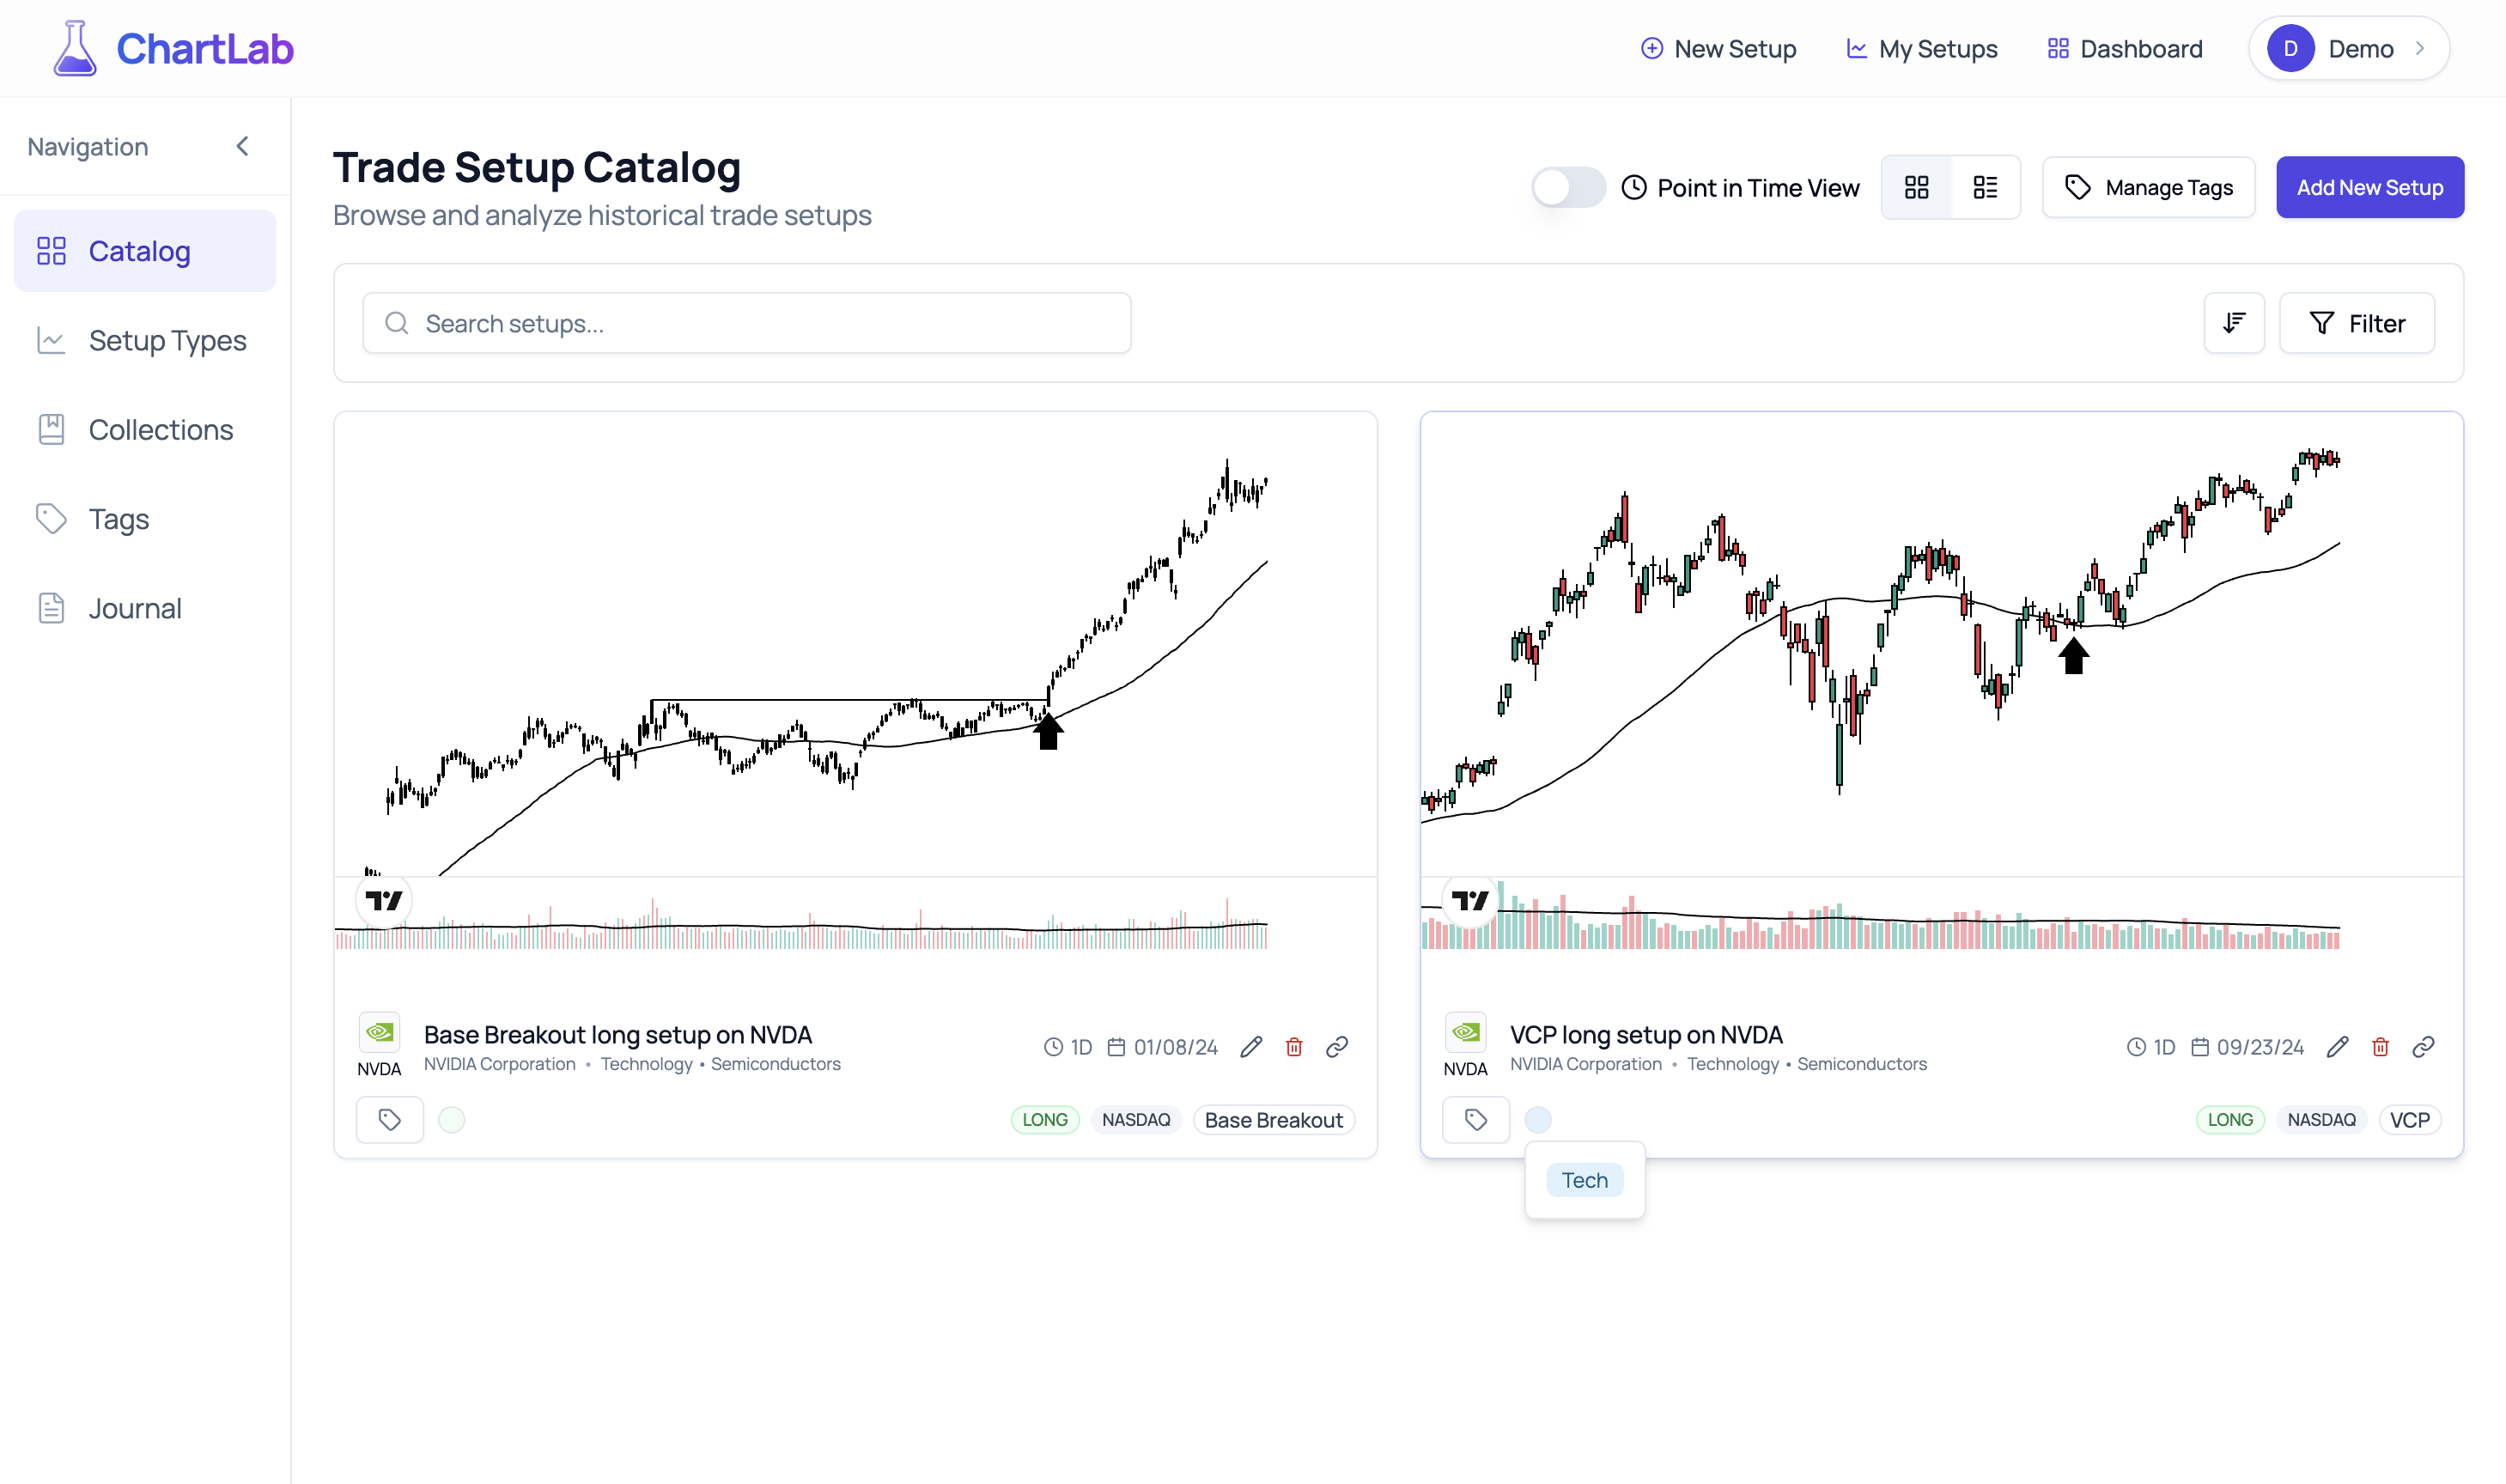
Setups with Tags - Visual Cues and Enhanced Filtering
Example Tagging Strategy: You might tag a VCP setup with "High Volume", "Tech Sector", "Earnings Catalyst", and later add "Winner" if the trade was successful. This creates a rich, searchable database of what conditions, patterns, and market environments lead to your best (and worst) trades.
Point-in-Time View - Eliminate Hindsight Bias
One of ChartLab's most revolutionary features is the Point-in-Time View toggle, accessible in your Catalog and further enhanced in the View Setups section (which we will cover in detail in Review and Study Your Setups in 'View Setups' - The Path to Mastery). This powerful tool is designed to eliminate hindsight bias, allowing you to analyze setups as they appeared at the exact moment you documented them. When activated in the Catalog, it shows your charts exactly as they appeared when you documented the setup, hiding all future price action.
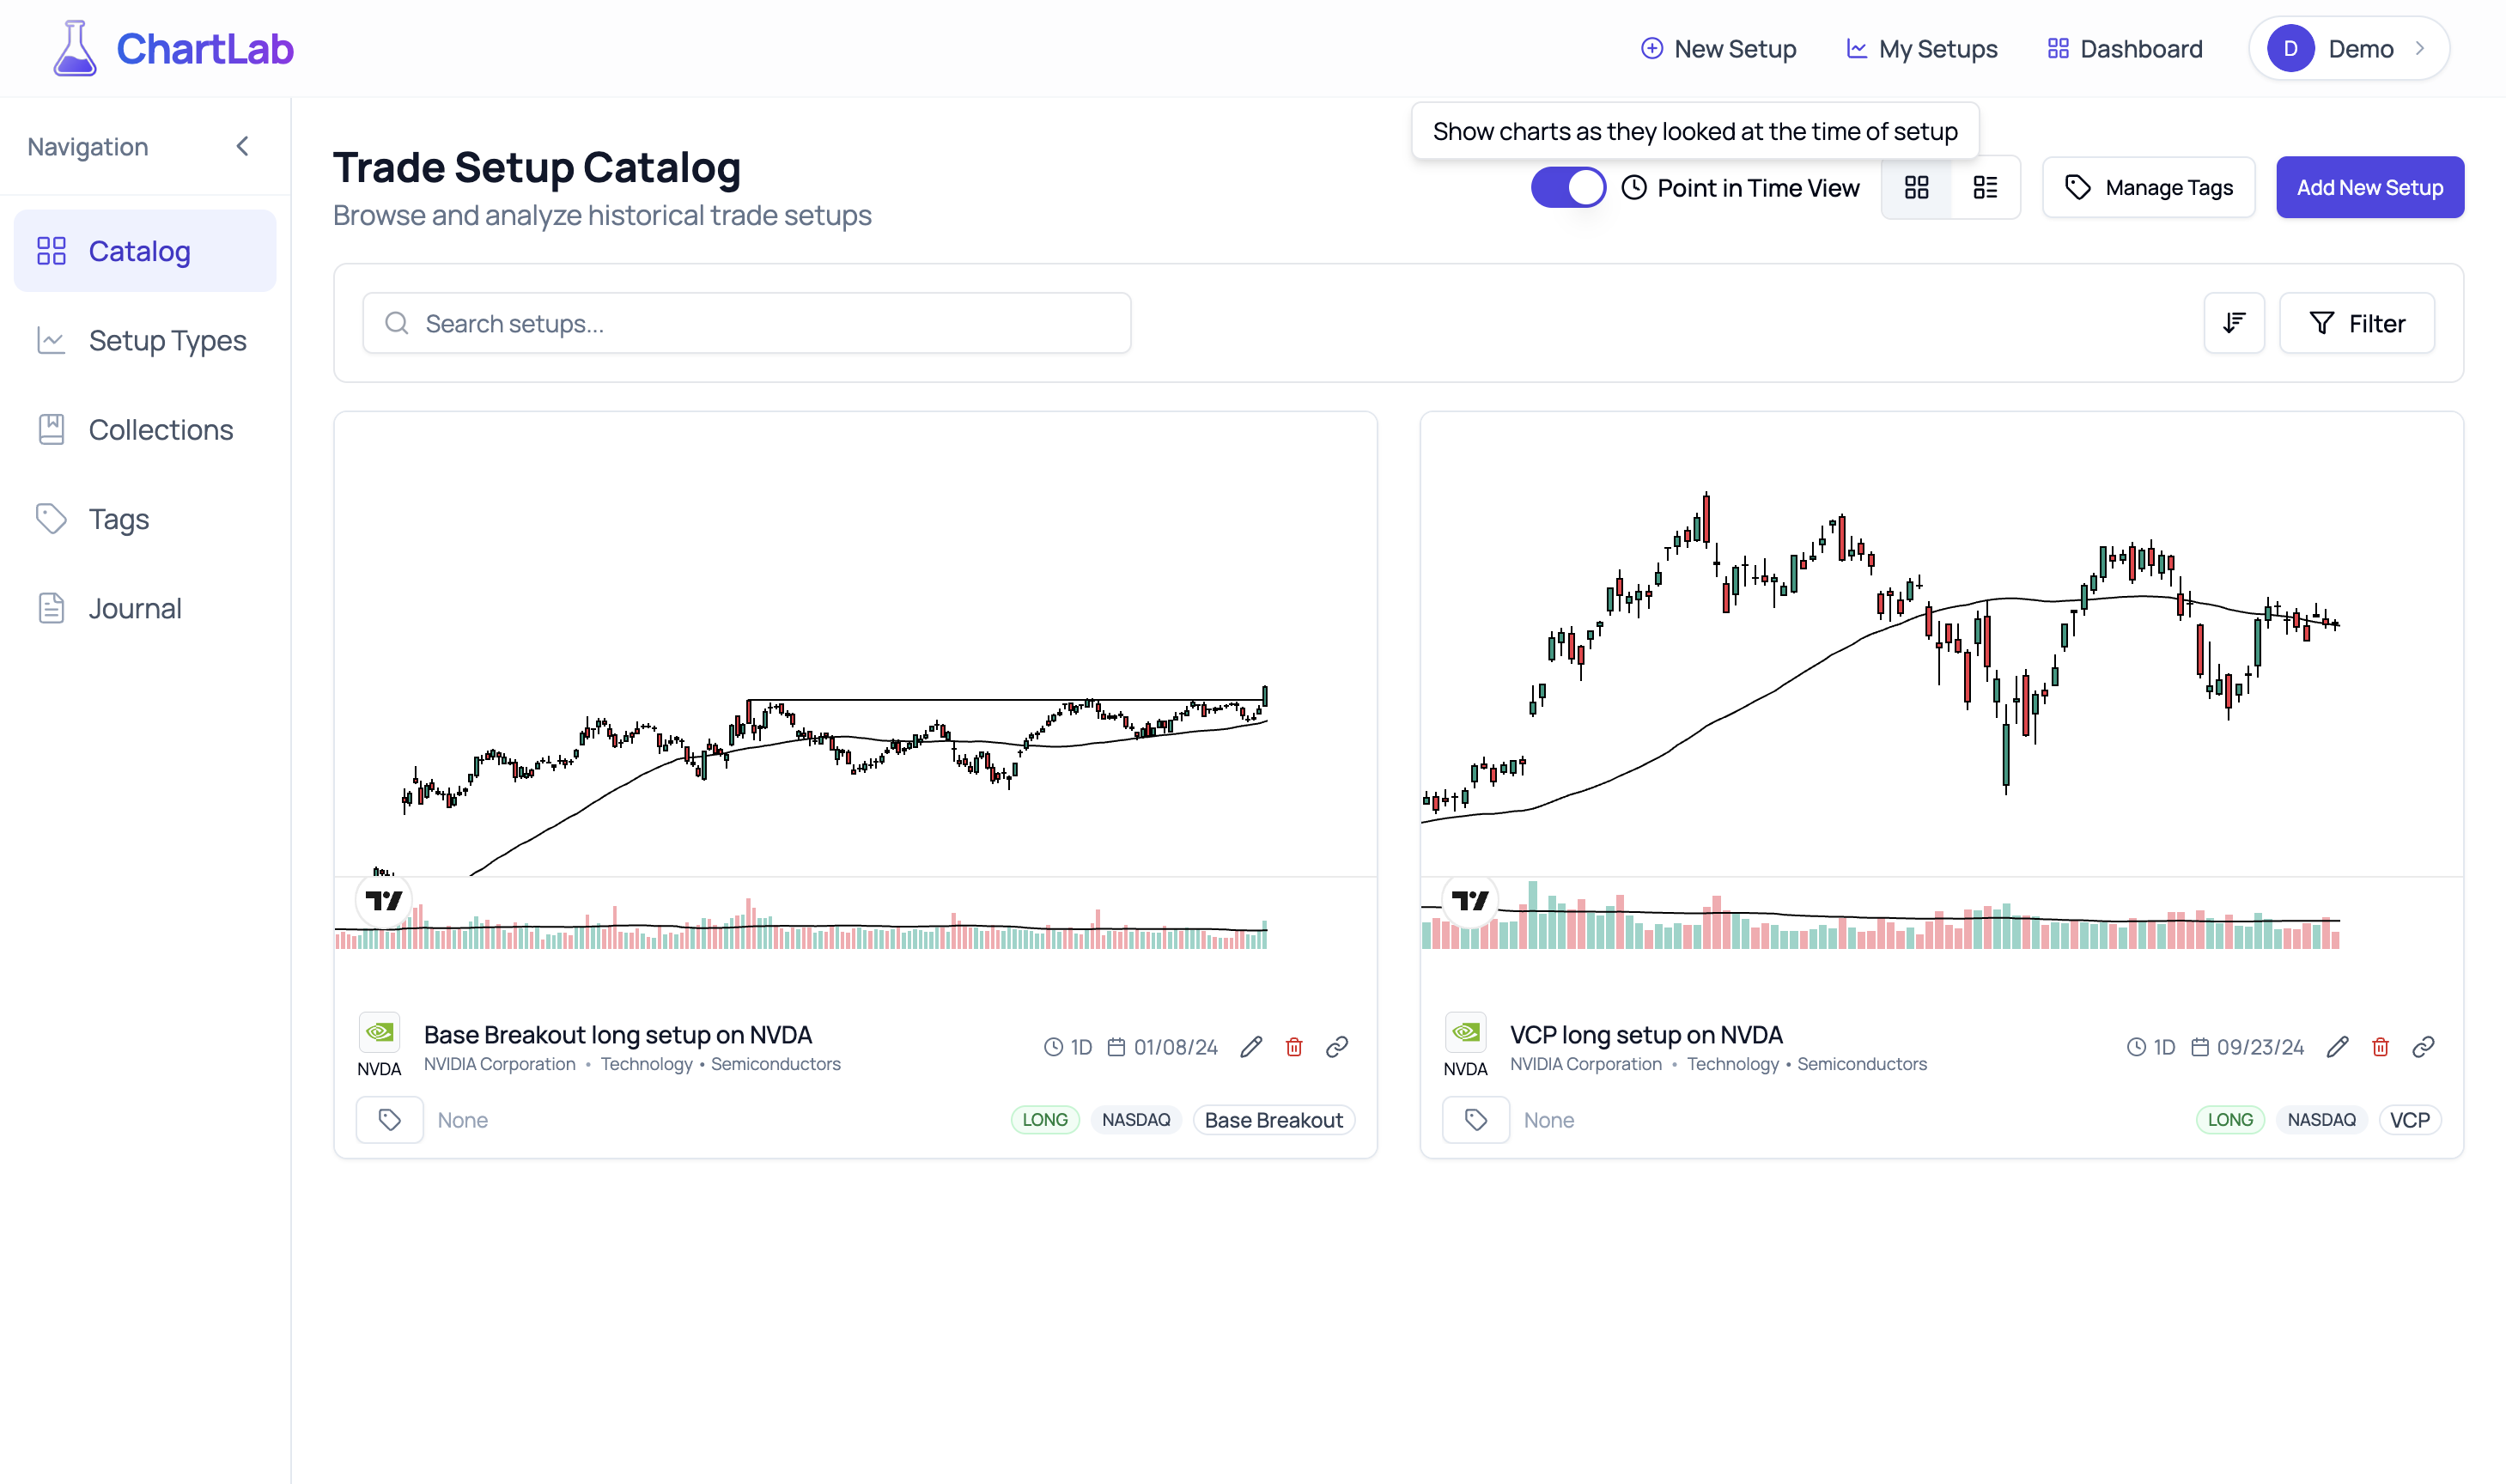
Point-in-Time View Toggle - See the Market as It Was
This feature is essential for:
- Objective Review: Study your past setups without the influence of knowing the outcome.
- Realistic Practice: Train your pattern recognition skills under conditions that mimic live trading.
- Building True Conviction: Develop confidence in your analysis based on how patterns actually looked at the decision point.
Share Your Analysis - Collaborate and Educate
ChartLab isn't just for solo research; it's a powerful tool for sharing your insights with the trading community, mentors, or a private group.
Generate Shareable Links Instantly
Each setup in your Catalog has a dedicated share icon. Clicking this generates a unique, public link to an interactive version of your setup.
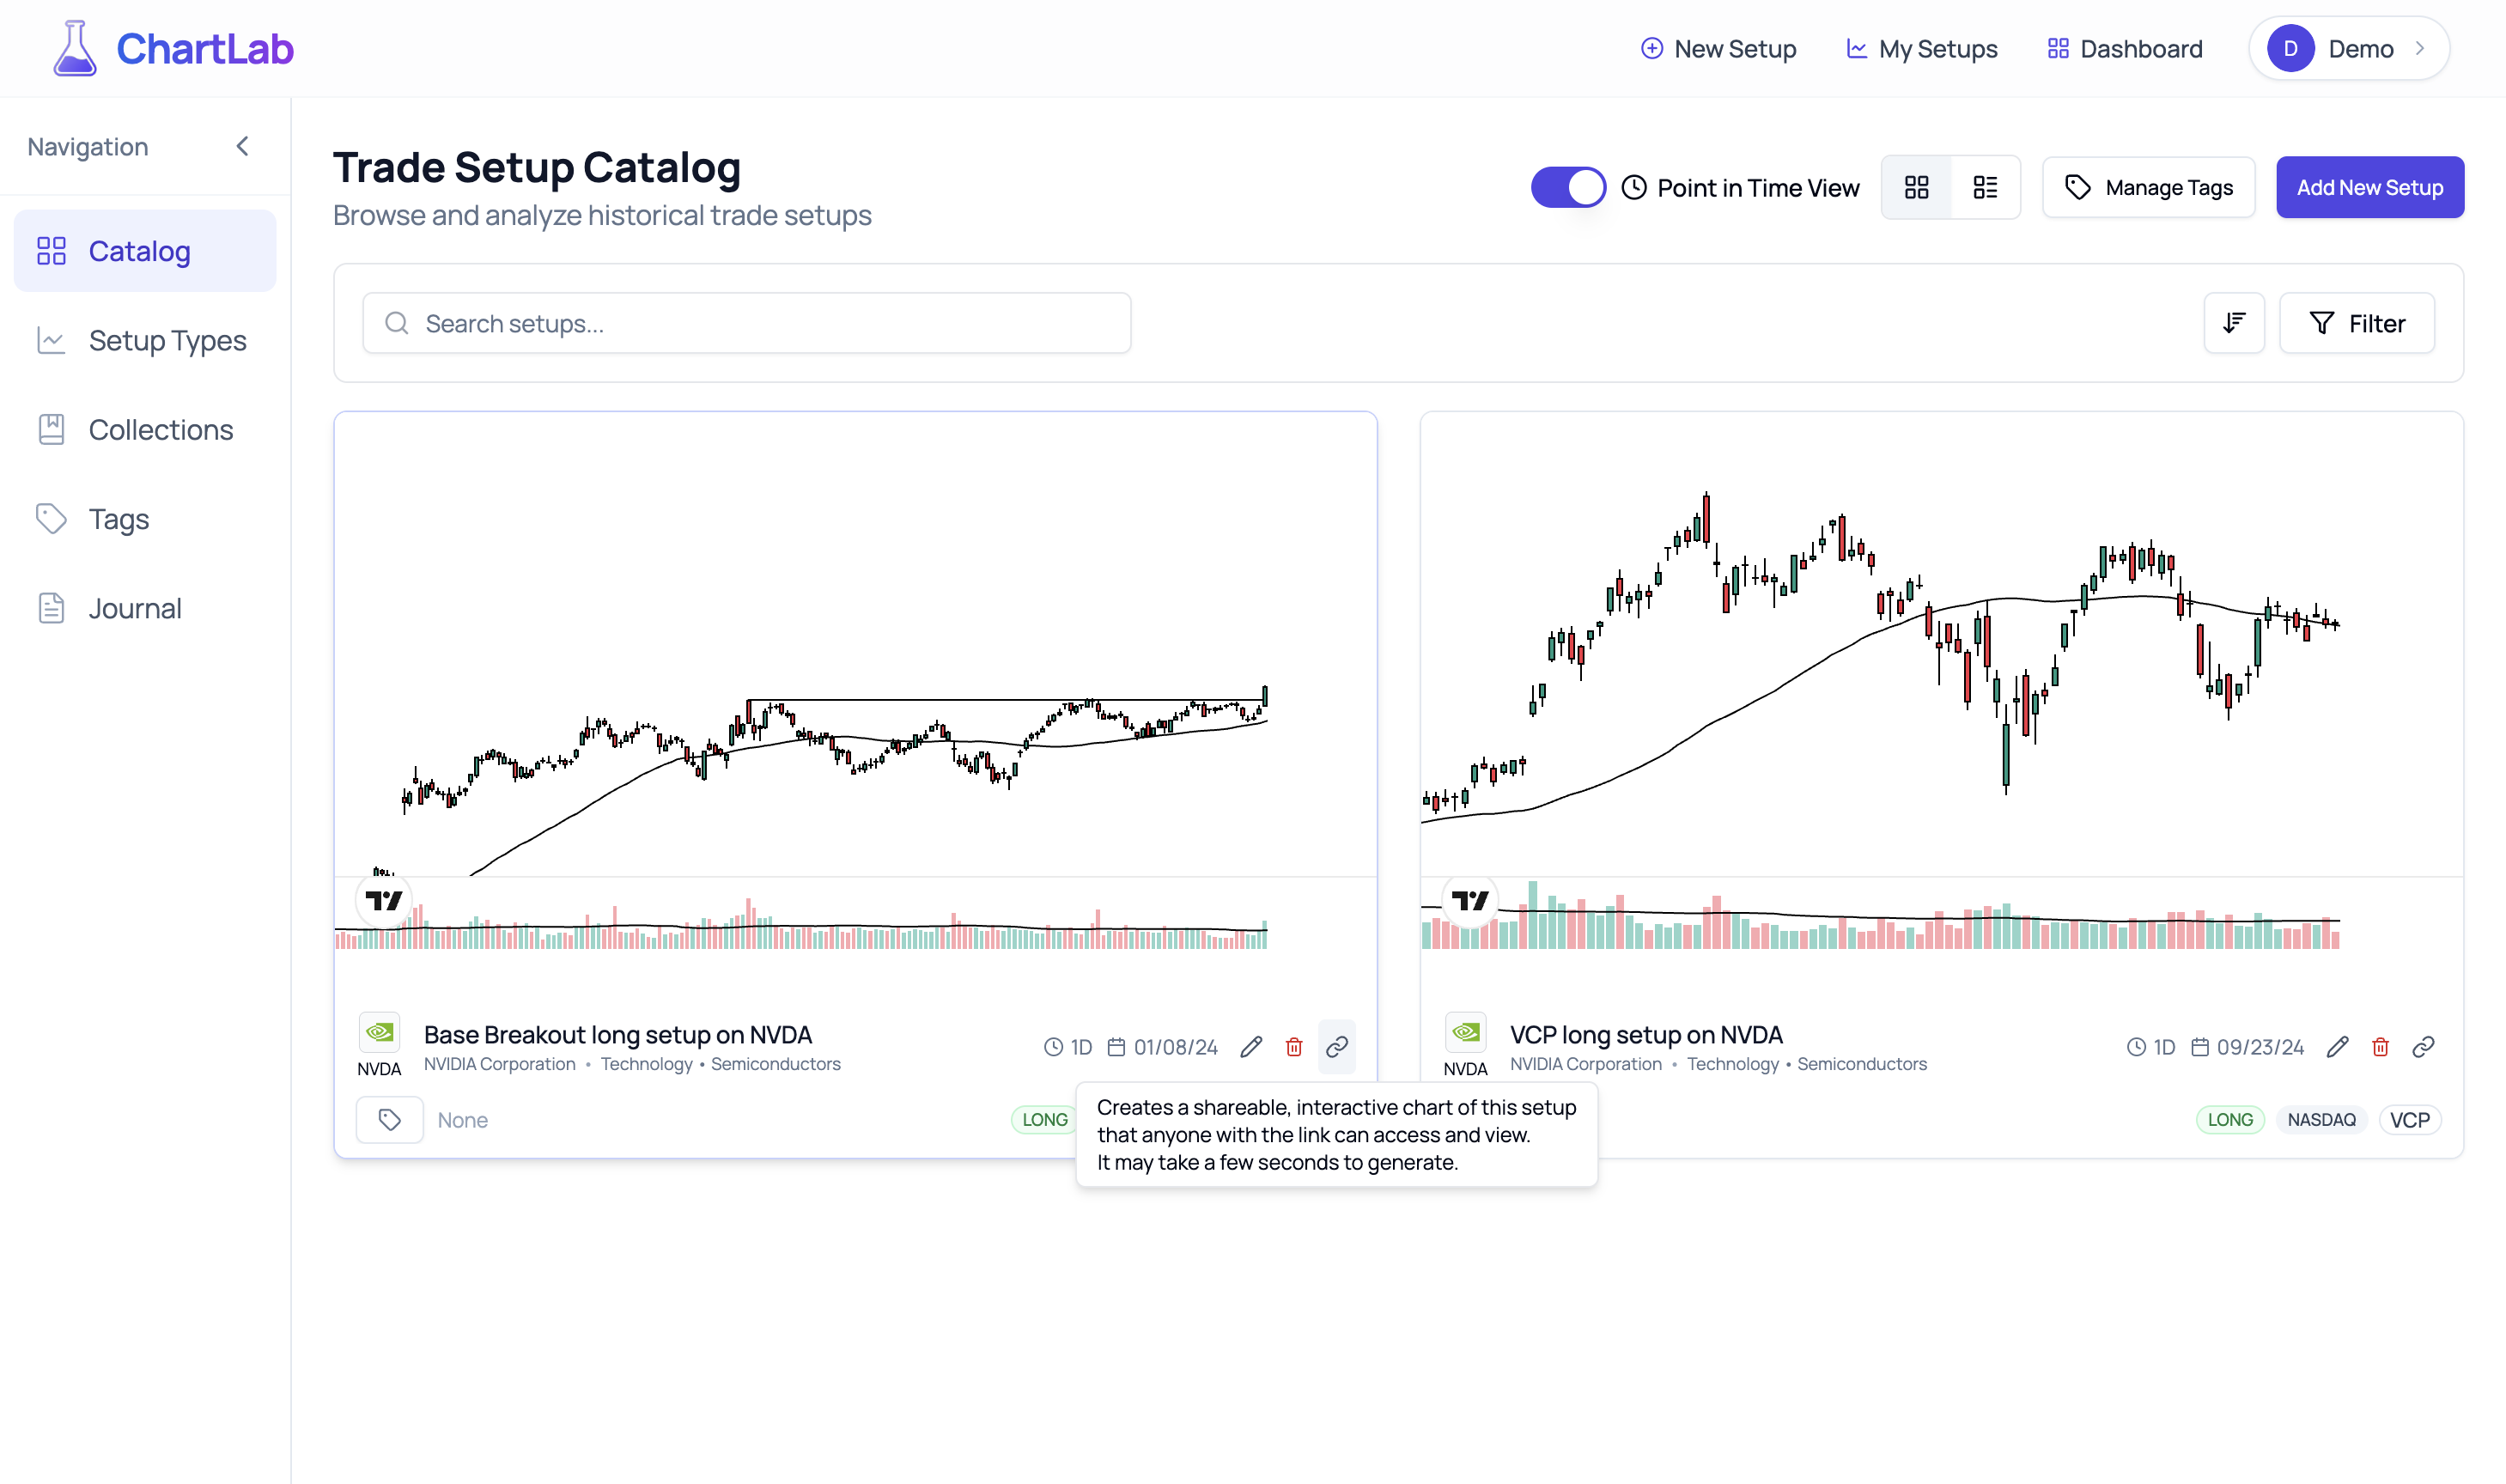
Share Setup Tooltip - Easy Sharing of Interactive Charts
When someone opens your shared ChartLab link, they don't just see a static image. They get:
- A Rich Preview: Your setup's name, symbol, and type are clearly displayed.
- A Fully Interactive TradingView Chart: All your original annotations, indicators, and the exact timeframe are preserved. Viewers can zoom, pan, and explore your analysis further.
- A Responsive Experience: Shared setups look great and function perfectly on desktops, tablets, and mobile phones.
- No Account Needed: Recipients can view and interact with your shared setup without needing a ChartLab account, making it frictionless to share your insights broadly.
- Point-in-Time Toggle: Viewers can toggle between seeing the chart as it appeared when you documented the setup and the full chart with all subsequent price action.
For example, a shared link might look like: https://chartlab.app/share/12345.
This shared setup maintains all your technical analysis, annotations, and the exact timeframe you were viewing, making it an invaluable tool for:
- Trading Education: Clearly demonstrate your strategies to students or followers.
- Community Discussions: Share your market calls on social media or forums with full chart context.
- Collaborative Analysis: Discuss specific setups with trading partners or mentors.
Review and Study Your Setups in 'View Setups' - The Path to Mastery
Navigate to the View Setups section to access your complete, interactive catalog of documented patterns. This isn't just storage; it's your personal trading laboratory, where you refine your eye, test your hypotheses, and build deep market understanding.
Interactive Setup Review - Beyond Static Images
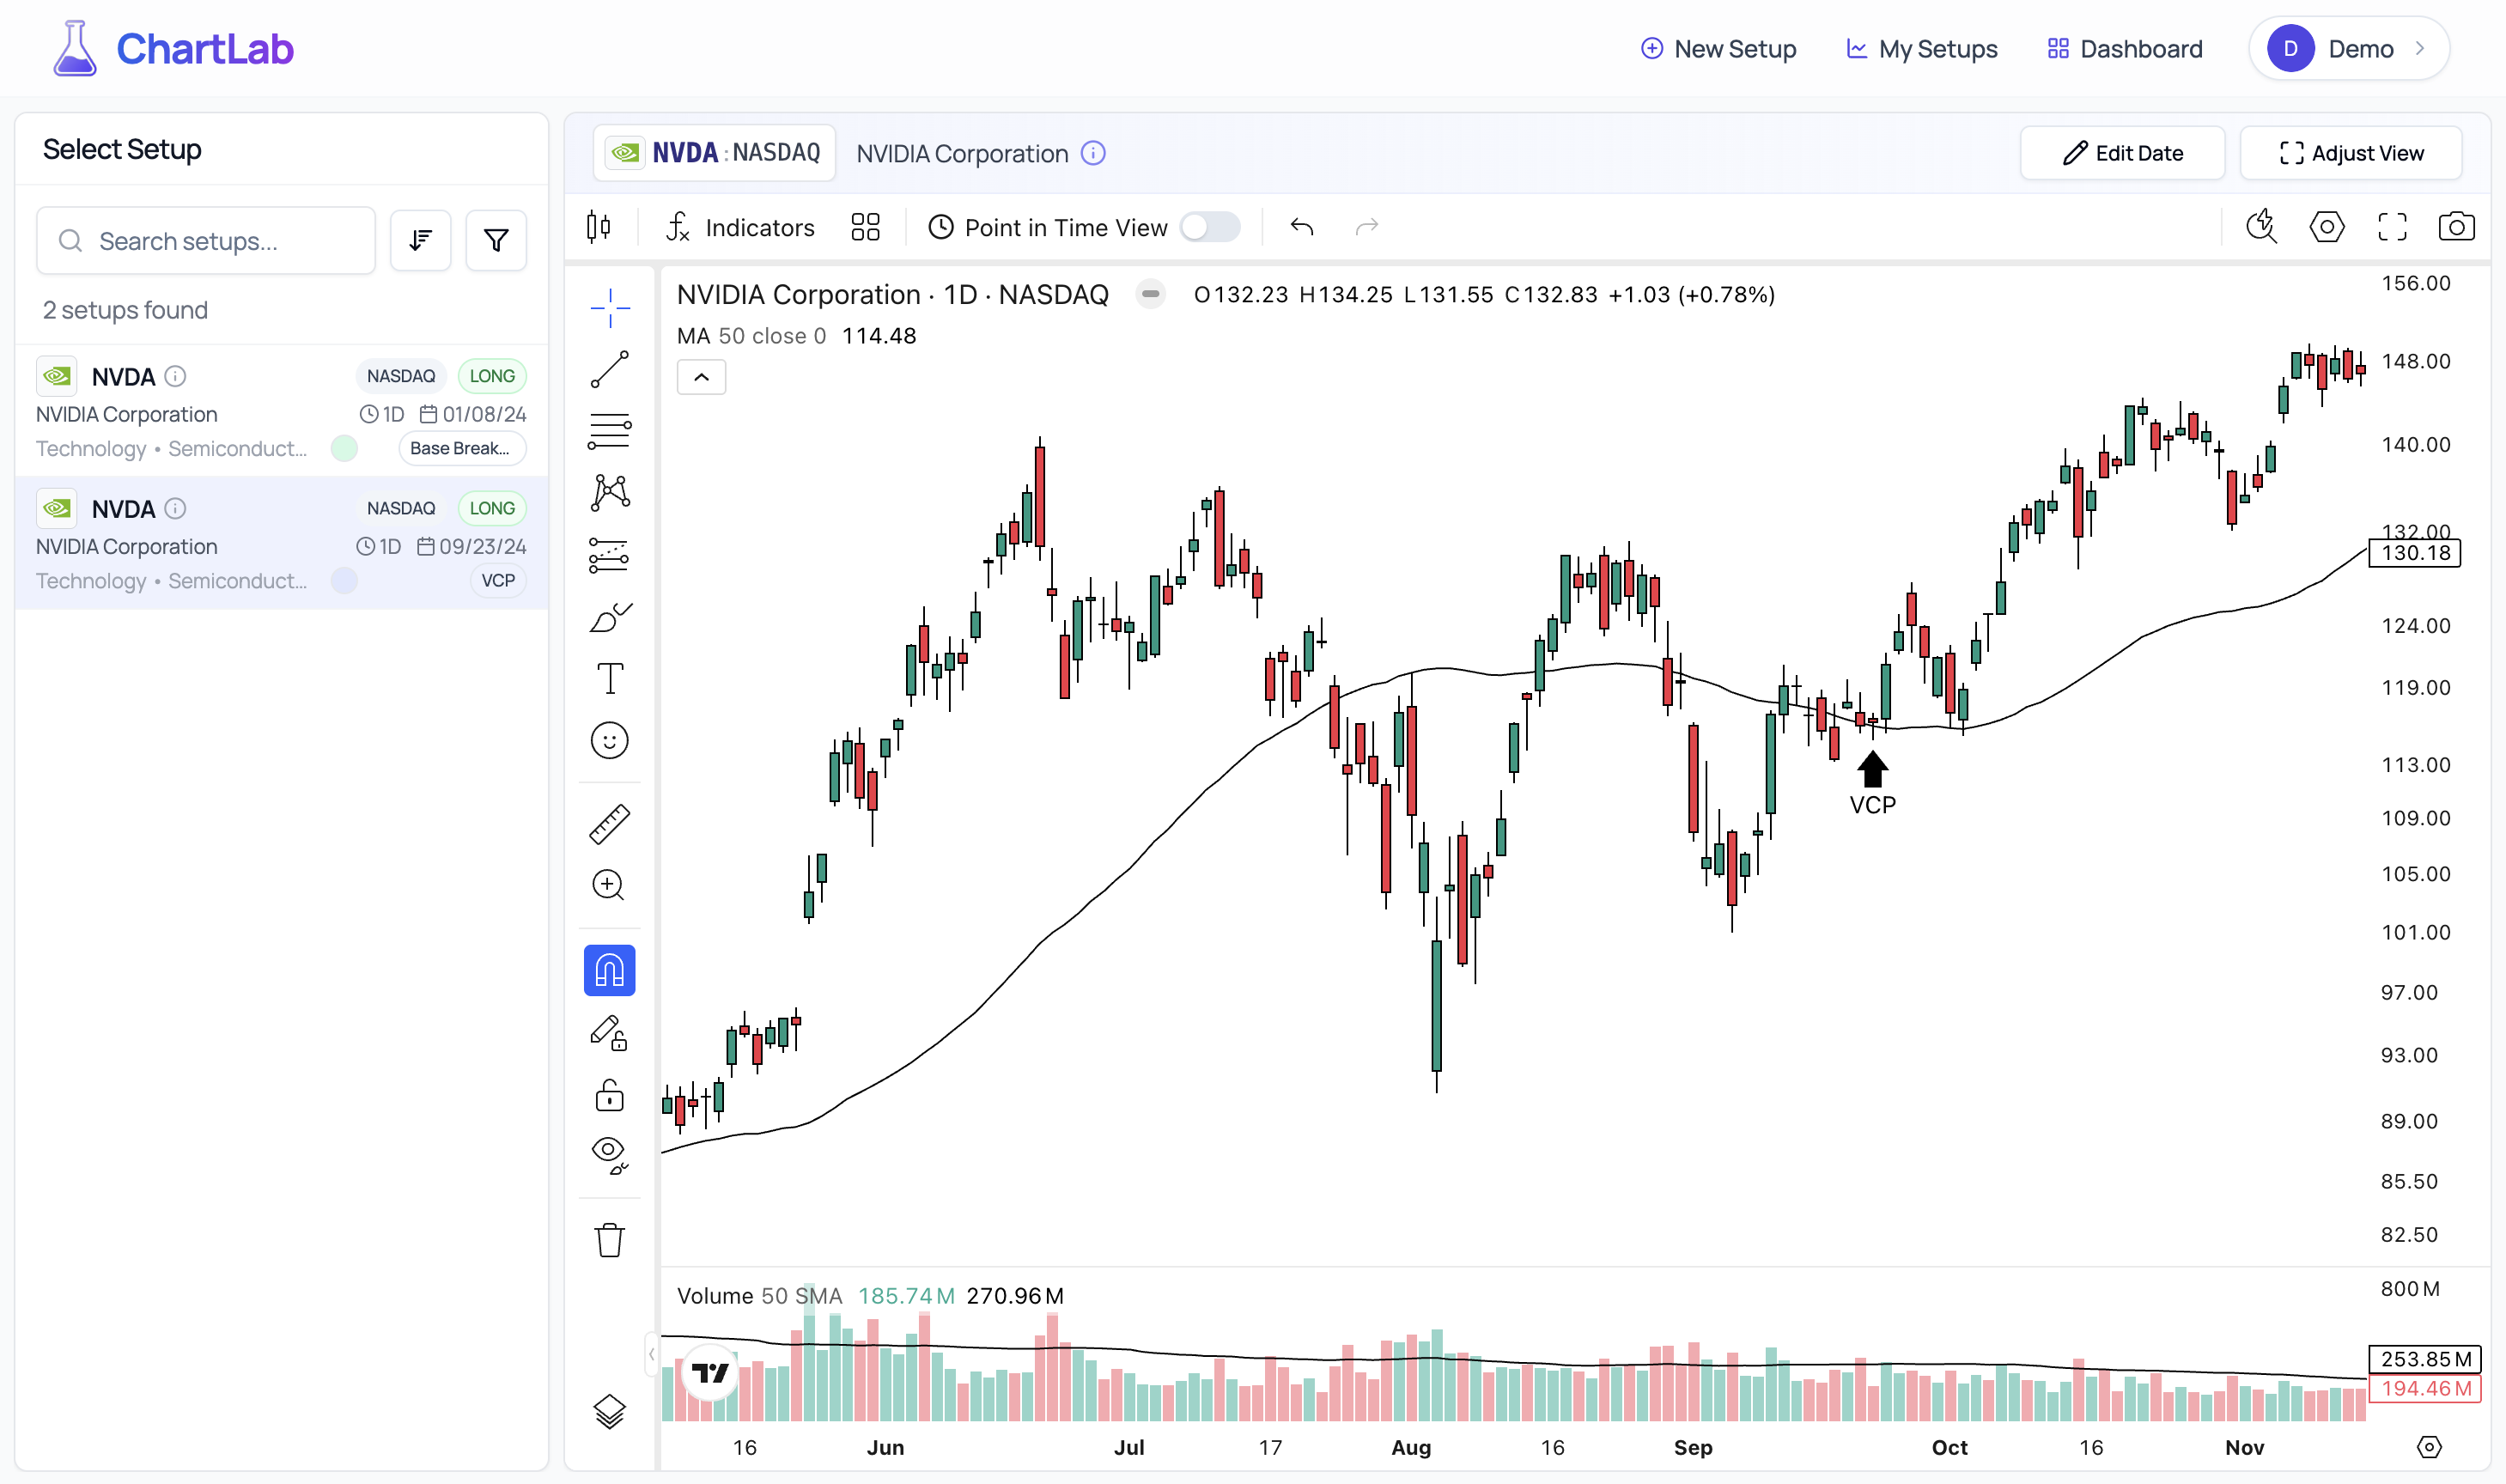
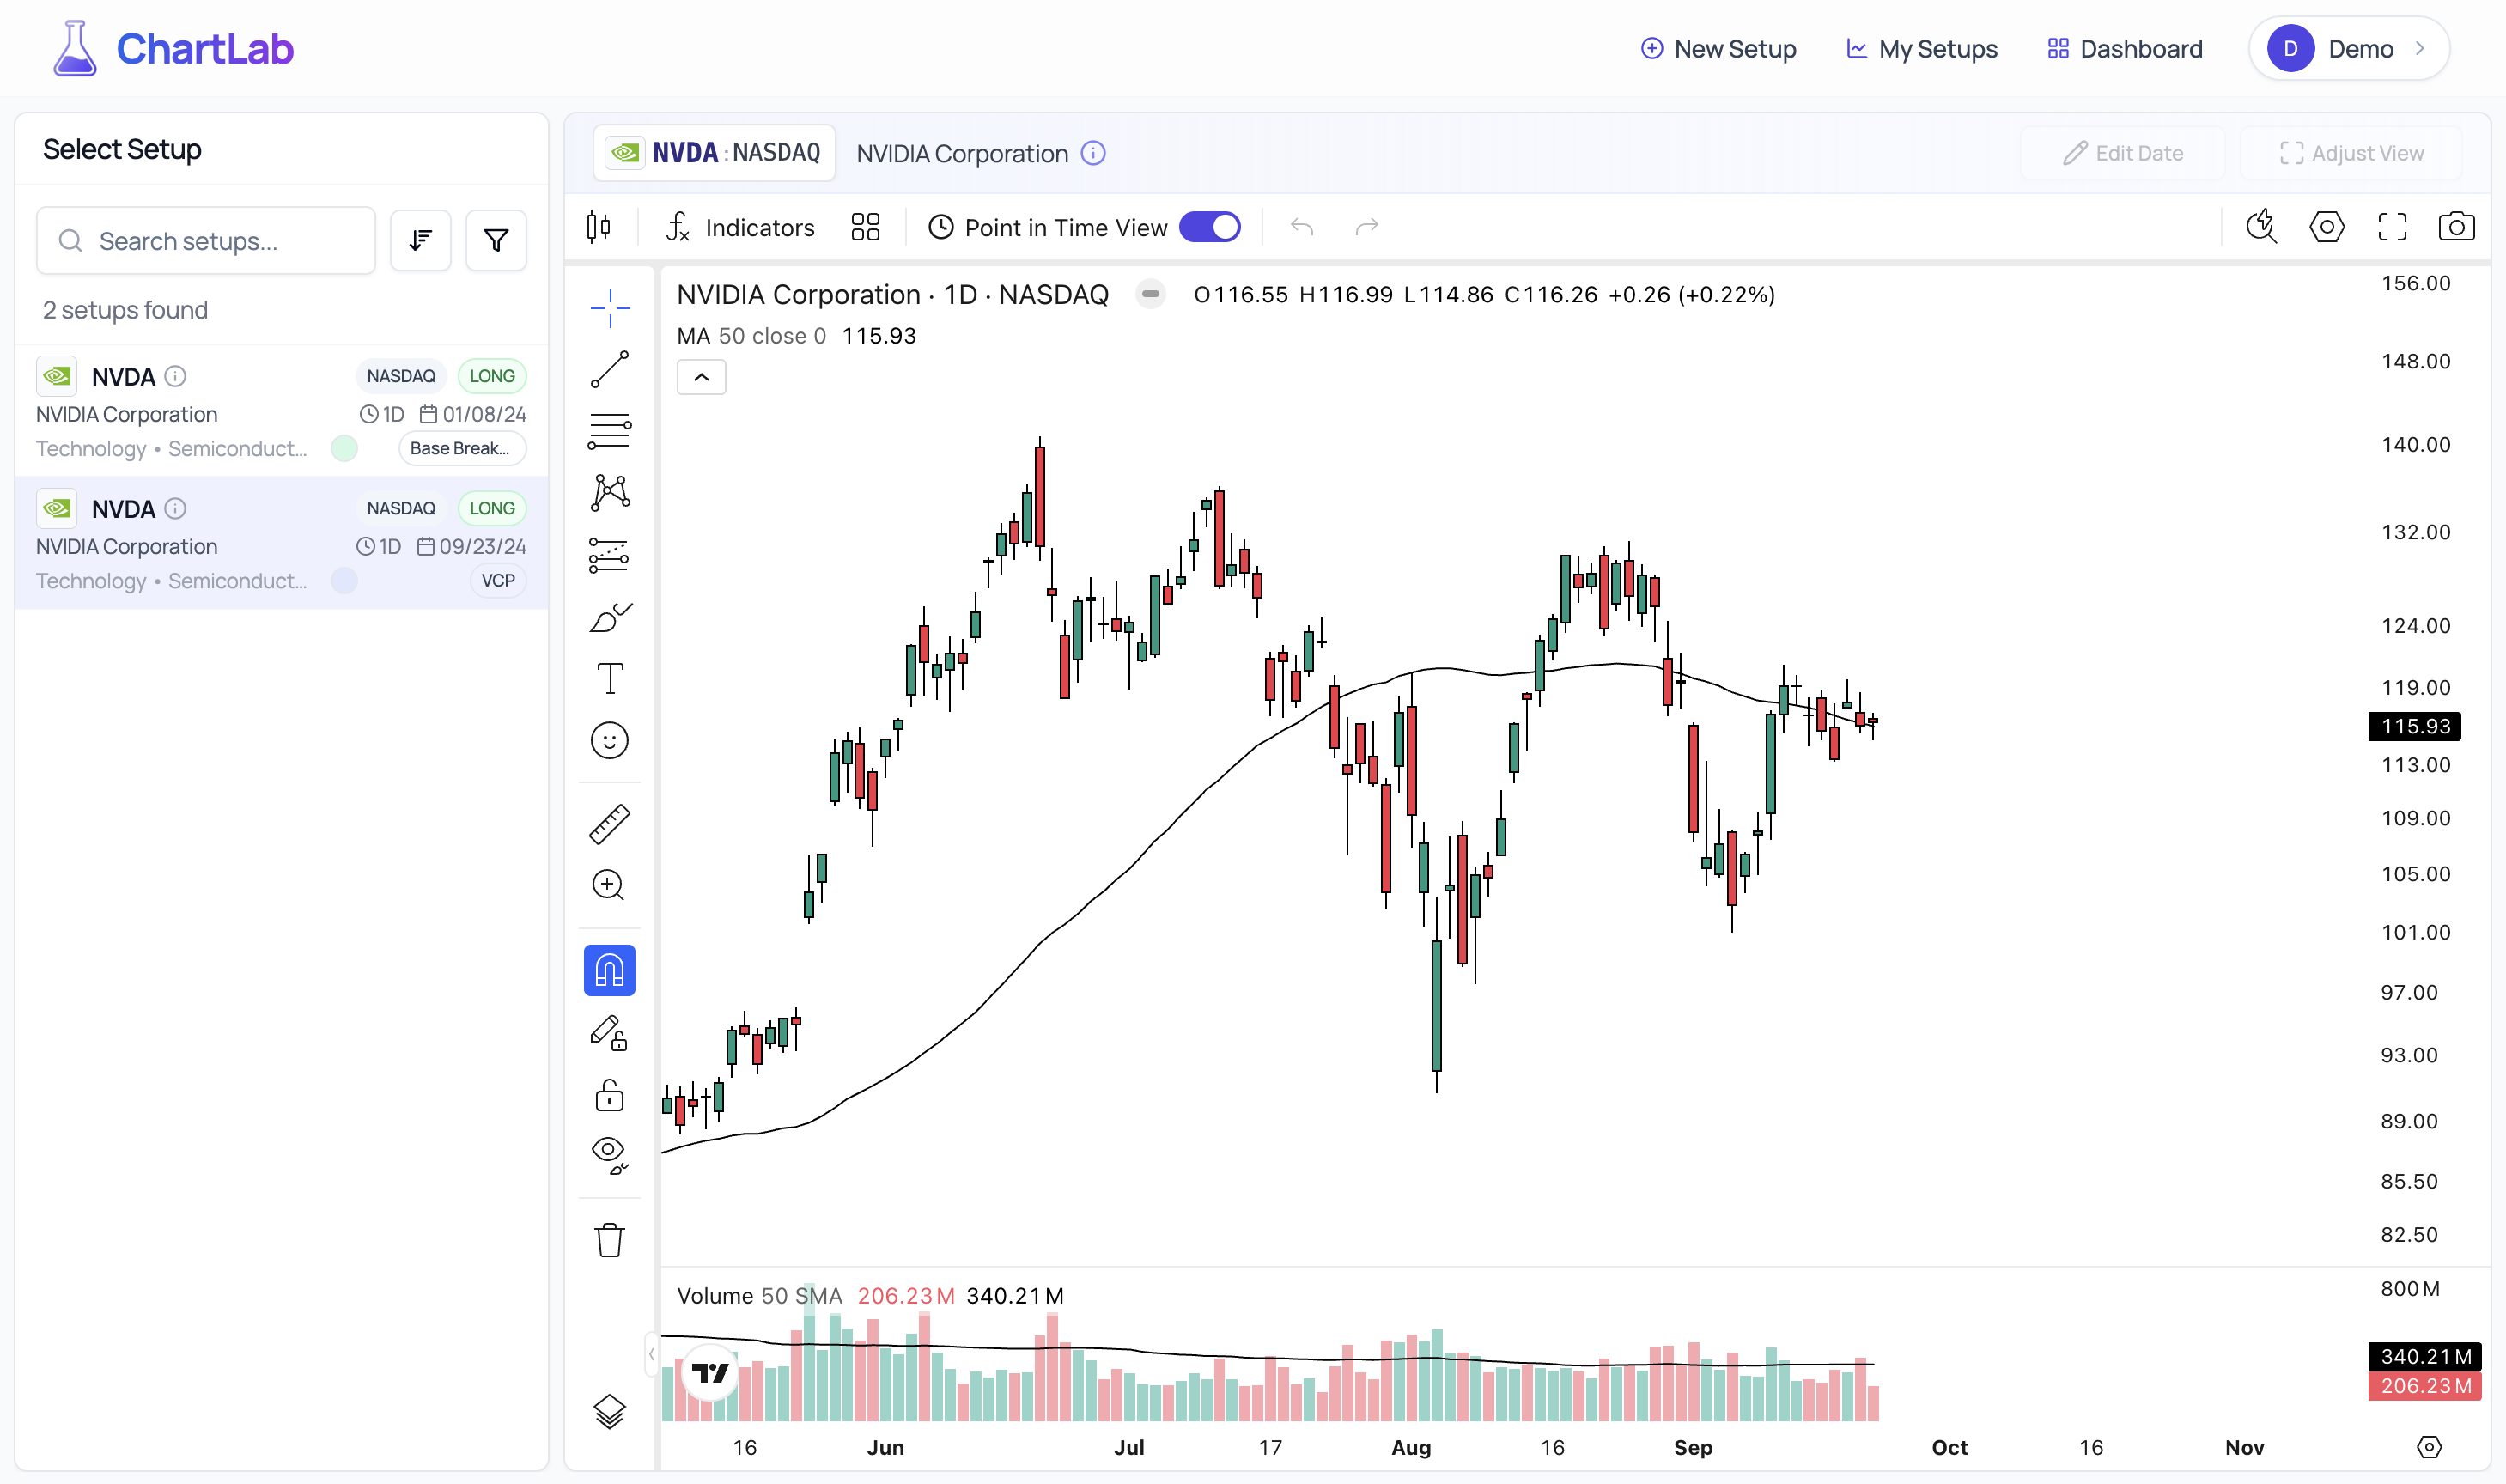
Click on any setup in your list to load it into ChartLab's powerful review interface. Each setup opens exactly as you saved it, but with full interactivity.
Reviewing a Saved Setup - VCP Pattern
While reviewing, you can:
- Modify Indicators: Add or remove indicators, or change their settings to see the pattern through different analytical lenses.
- Zoom & Pan: Explore different timeframes or focus on specific price action around your setup.
- Add New Analysis: Use drawing tools to mark new observations without altering the original saved setup.
- See How It Played Out: Crucially, you can scroll forward to see how the pattern resolved over time, providing invaluable feedback on your initial analysis.
- Edit Setup Details: You can adjust the setup date or the visible chart range to better frame your analysis.
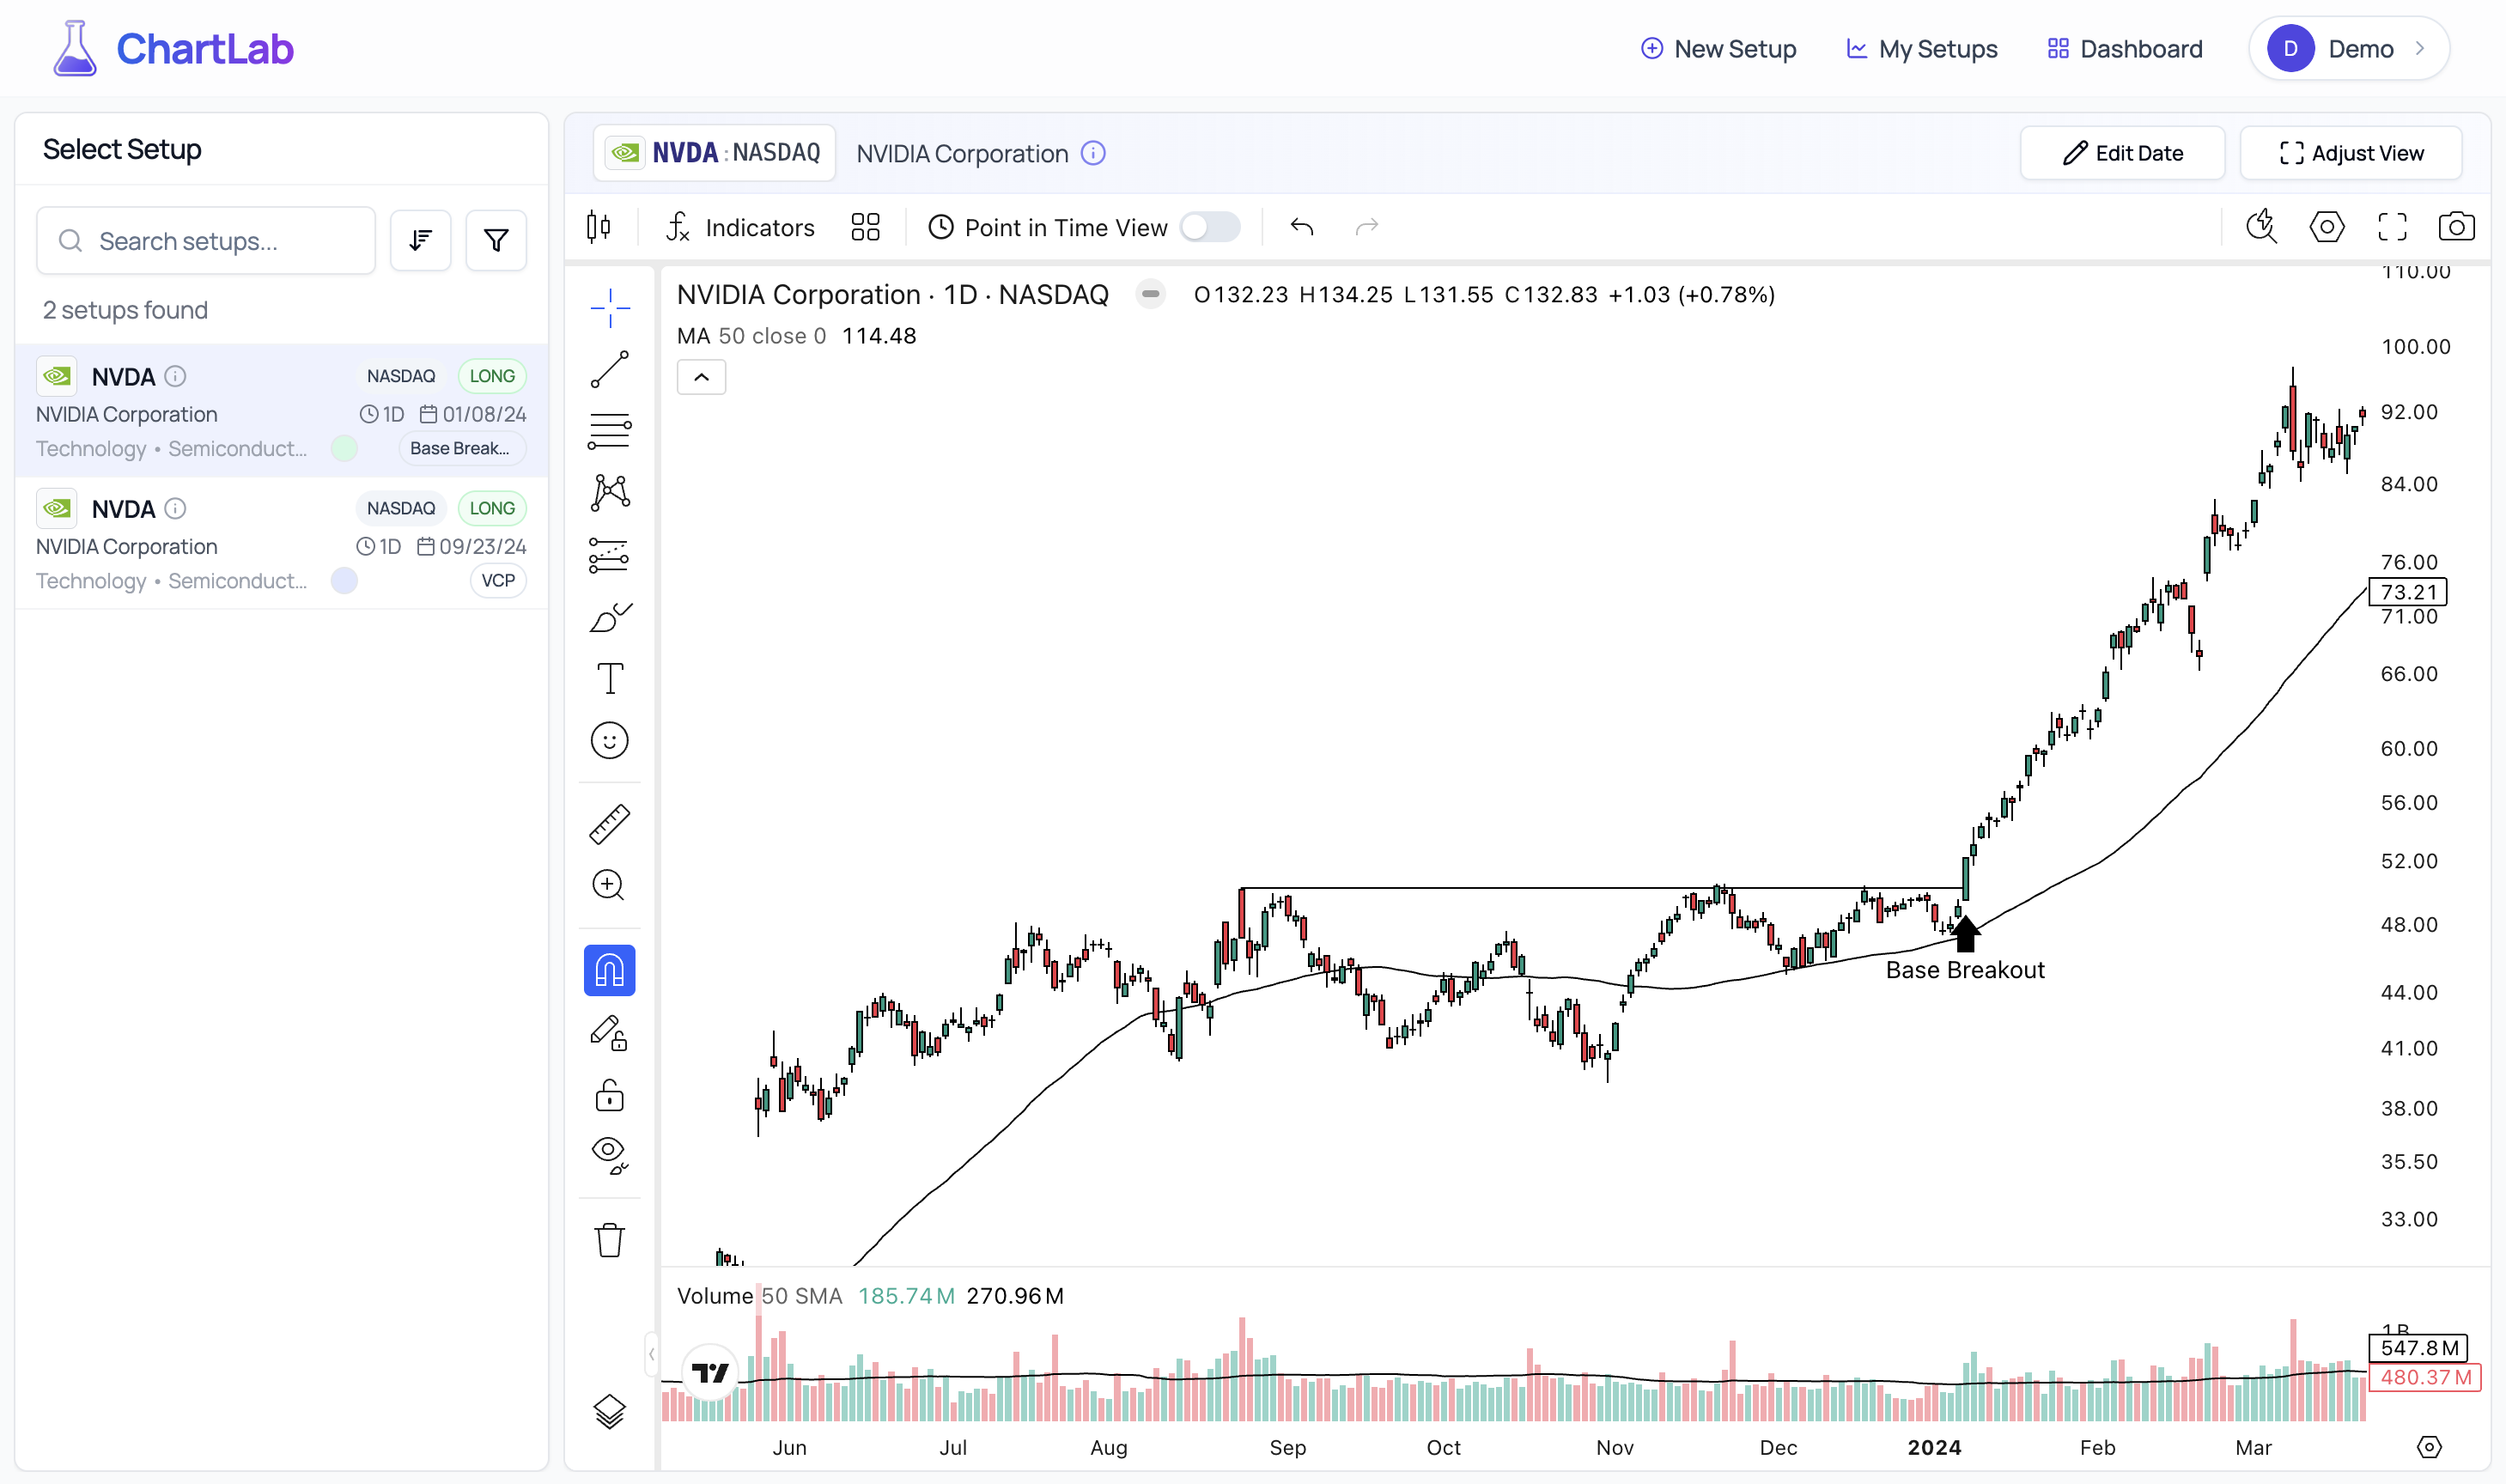
Reviewing Another Saved Setup - Base Breakout
Point-in-Time Analysis - Train Without Hindsight Bias
ChartLab's most transformative feature for self-improvement is the Point-in-Time Mode within the View Setups viewer. Toggling this on strips away all price data that occurred after you saved the setup.
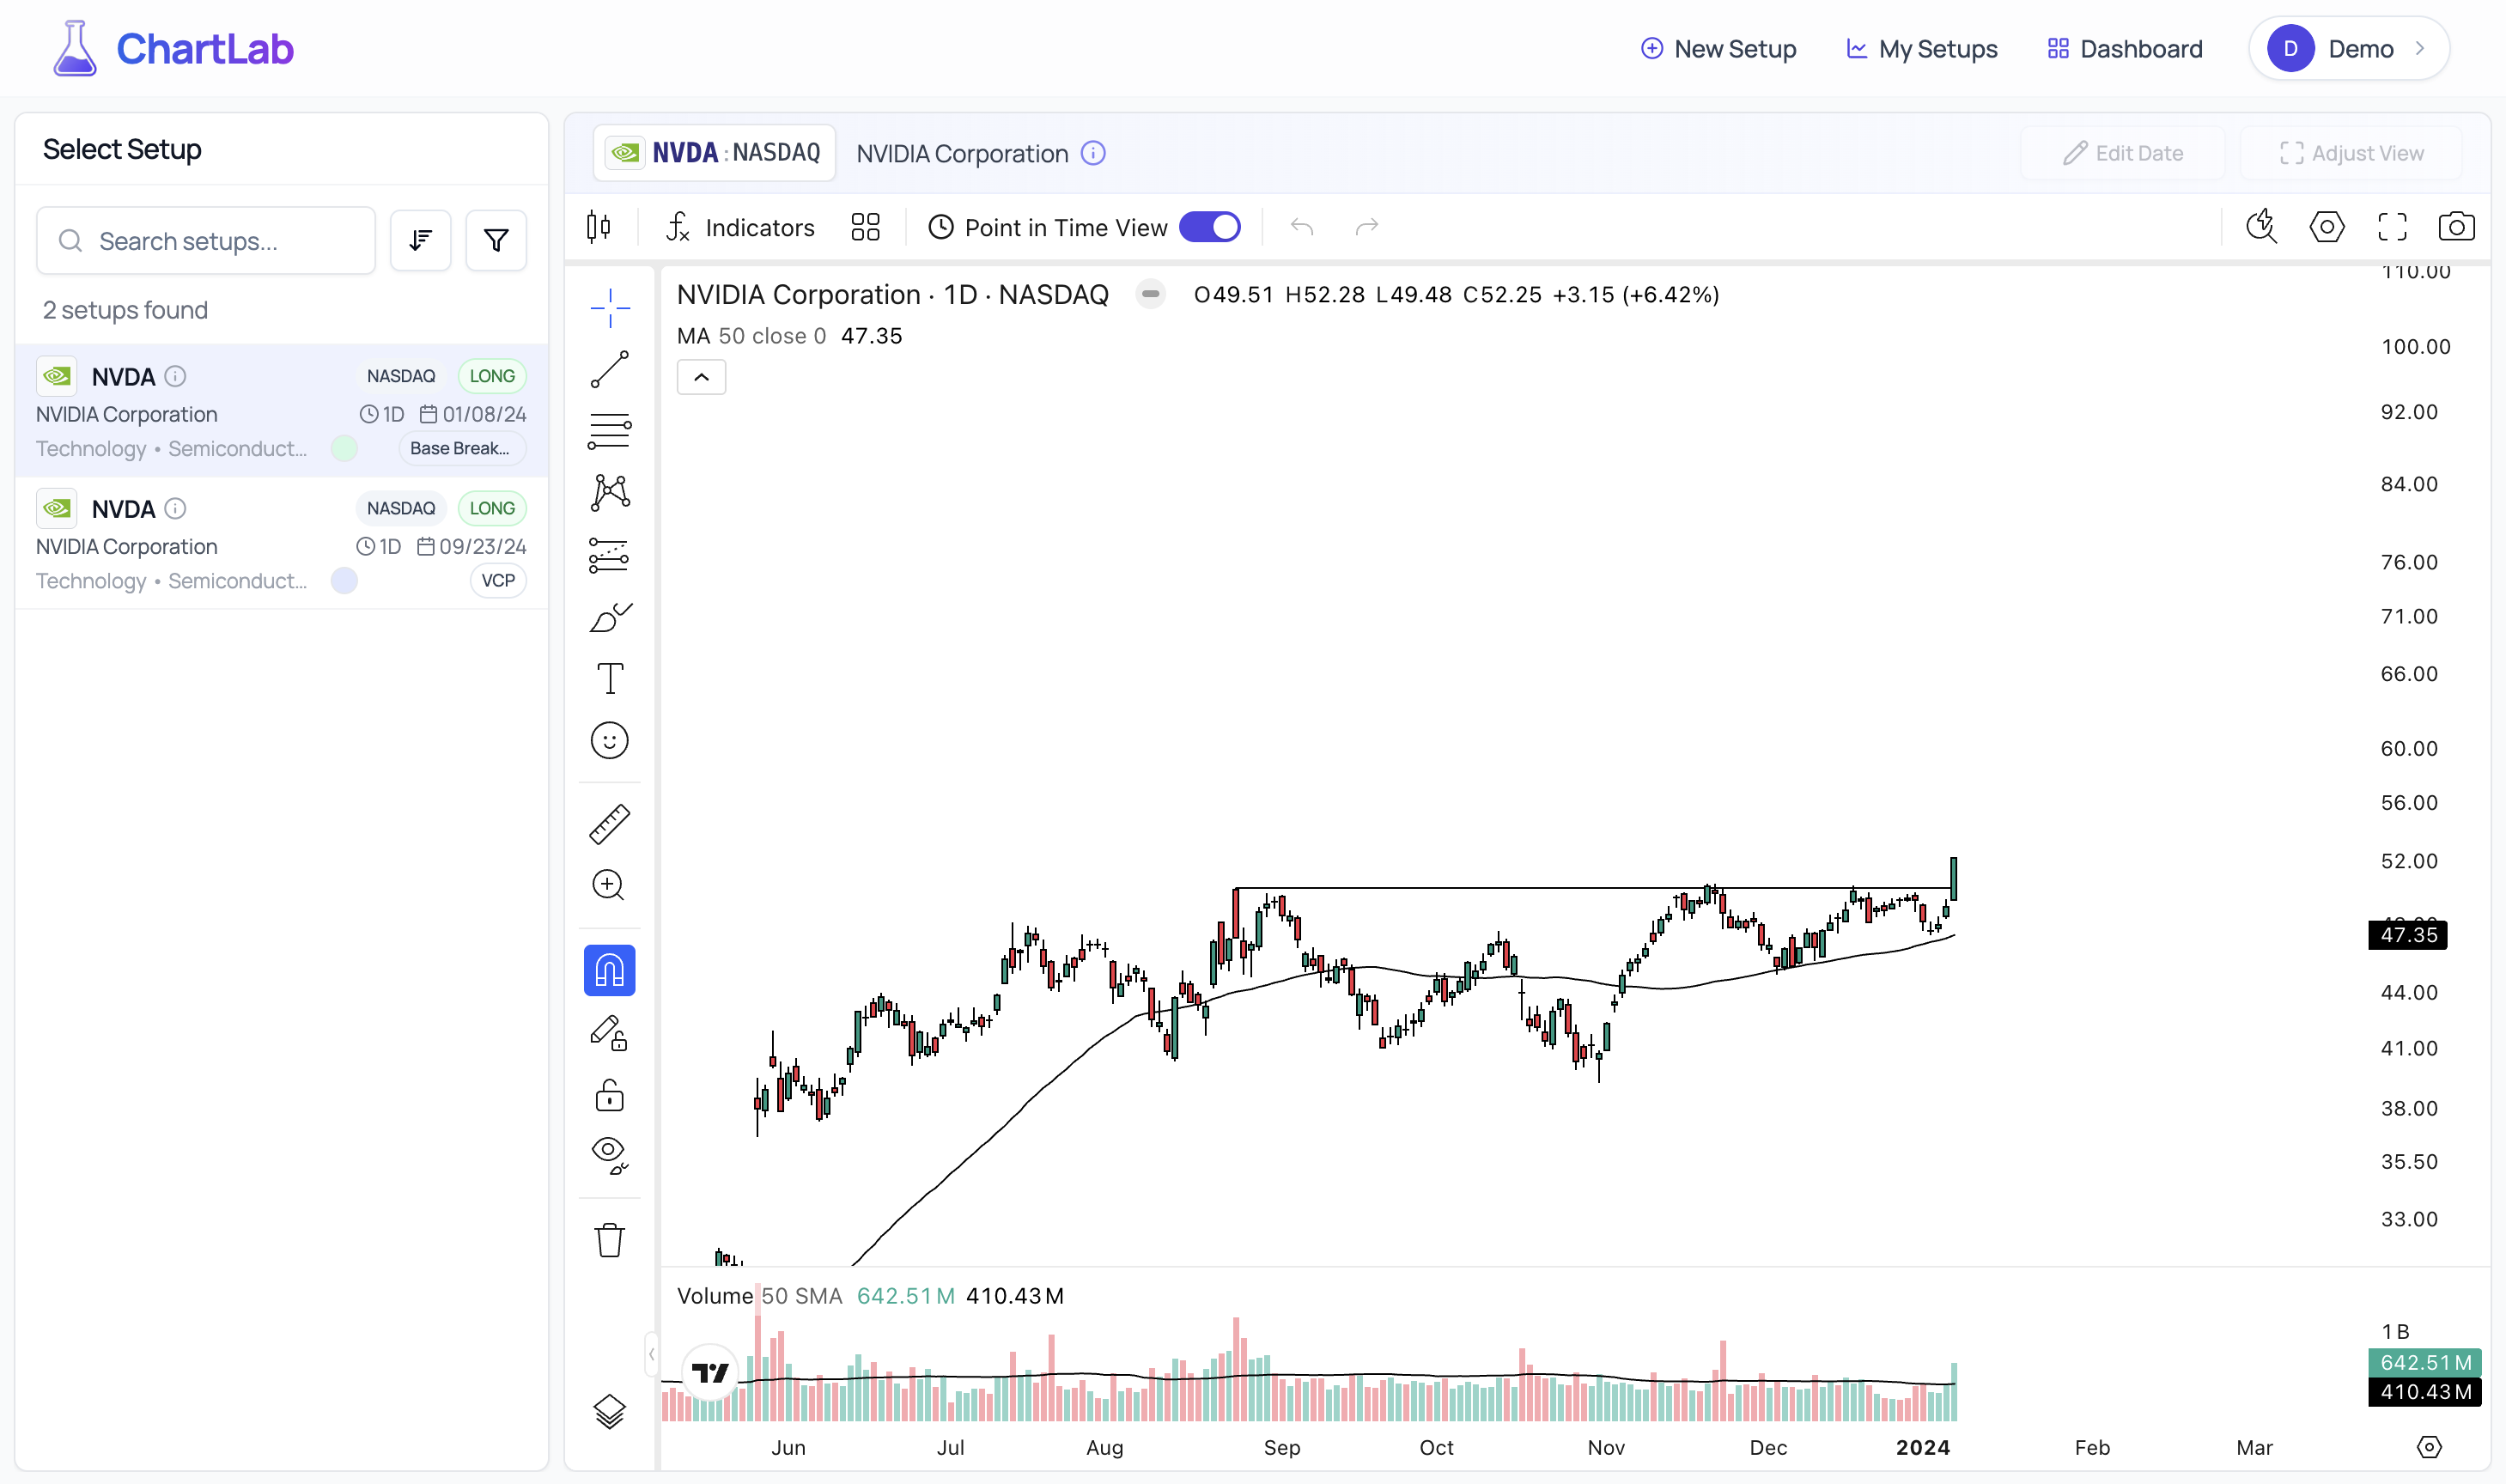
VCP Setup in Point-in-Time Mode - Pure Pattern Recognition
This is critical because:
- It Eliminates Hindsight Bias: You can't be swayed by knowing the outcome. You're forced to evaluate the pattern based only on the information available at the moment of decision.
- It Simulates Real Trading: This is as close as you can get to practicing pattern recognition under live market conditions, without risking capital.
- It Builds Genuine Skill: Repeatedly analyzing setups in point-in-time mode sharpens your ability to identify high-probability patterns before they play out.
Base Breakout in Point-in-Time Mode - Objective Analysis
Why Point-in-Time Matters for Mastery:
This feature transforms your saved setups from a passive archive into an active training ground. Use point-in-time mode to:
- • Test Your Rules: Does this setup truly meet all the criteria of your trading plan?
- • Develop Patience: See how patterns form and how often they might test your resolve before triggering an entry.
- • Build Conviction: By repeatedly seeing your patterns form and then (by switching off point-in-time) seeing them succeed, you build deep, experience-based conviction in your methodology.
- • Compare & Contrast: Easily flip between the point-in-time view and the full chart to understand what subtle cues might have hinted at the outcome.
Advanced Features and Workflows
Building Collections
As your setup catalog grows, organize related patterns into Collections. Group setups by:
- Time periods Q4 2024 Winners
- Strategies Mean Reversion Plays
- Performance High-Conviction Setups
- Learning themes Failed Breakouts Study
Chart Layout Management
Develop standardized chart layouts for different types of analysis:
- Momentum Analysis: RSI, MACD, volume indicators
- Mean Reversion: Bollinger Bands, oversold indicators
- Breakout Patterns: Volume, moving averages, support/resistance
Cross-Reference Analysis
Use ChartLab's tagging and filtering system to discover patterns across your research:
- Which setup types perform best in different market conditions?
- How do your patterns behave around earnings or economic events?
- What commonalities exist among your most successful setups?
Conclusion: Building Your Trading Edge
ChartLab transforms trading research from a collection of static screenshots into a dynamic, searchable model book that evolves with your understanding of the markets. By systematically documenting setups with proper categorization, comprehensive tagging, and point-in-time analysis, you're building a valuable resource that will serve your trading career for years to come.
The key to maximizing ChartLab's value is consistency. Document setups regularly, maintain your tagging system, and regularly review your catalog to reinforce pattern recognition. Over time, you'll develop genuine conviction in your trading approach based on documented evidence rather than gut feelings or market folklore.
Whether you're studying the cup and handle patterns that William O'Neil wrote about, documenting your own unique strategies, or sharing insights with the trading community, ChartLab provides the tools to bring your research to life.
Ready to start building your model book? Your trading edge is waiting to be discovered, documented, and refined.