Why We Built ChartLab: Bringing Setups to Life
When we set out to build ChartLab, it wasn't just another "project." It was personal.
As traders, we lived the same frustration many of you know too well: documenting promising chart setups meant taking screenshots, saving them in messy folders, and maybe tossing a few notes into a spreadsheet. If you wanted to review a setup later with a different indicator, timeframe, or chart style? Good luck. You were stuck with static images that couldn't be changed.
Chart screenshots are dead moments in time. Trading is alive.
Example of a trading chart showing a pattern over time
We built ChartLab because we believe your research should be living and dynamic — just like the markets.
The Problem: Static Screenshots Were Holding Us Back
Saving chart setups as screenshots felt like the best option… until it wasn't. We wanted to:
- See the same setup with different indicators overlaid
- Zoom into different timeframes to understand price action more deeply
- Adjust chart styles to match how we see the market
- Easily share setups with friends, mentors, and trading communities without losing the dynamic chart
- Lock in the exact point in time a setup occurred, without worrying about future price action distorting the view
But every time we needed a different view, it meant going back, reloading historical data manually, reapplying indicators, recreating the environment… or worse, starting from scratch.
That process killed momentum, and sometimes, the insight we were chasing slipped away.

Frustrated trader dealing with static screenshots
Our Vision: A Living, Breathing Model Book
ChartLab is built for traders who believe that true conviction comes from putting in the work.
We wanted a place where:
- You could document historical setups systematically, not just randomly.
- Every setup was live and interactive — not a frozen picture.
- You could revisit a setup, tweak indicators, adjust the view, and dig deeper anytime.
Documenting a VCP setup in ChartLab
- You could share a live version of your setup with a single link — not a dead screenshot. When you share a ChartLab link, you're sharing an active TradingView chart, preserving the full flexibility to view, explore, and learn.
- You could use our Point-in-Time View to see the market exactly as it looked in real time when the setup formed — no spoilers, no future candles — allowing you to study setups with the same uncertainty and context traders faced in the moment.
The Power of Point in Time View
One of our most powerful features is the Point in Time view. Compare these two views of the exact same setup:
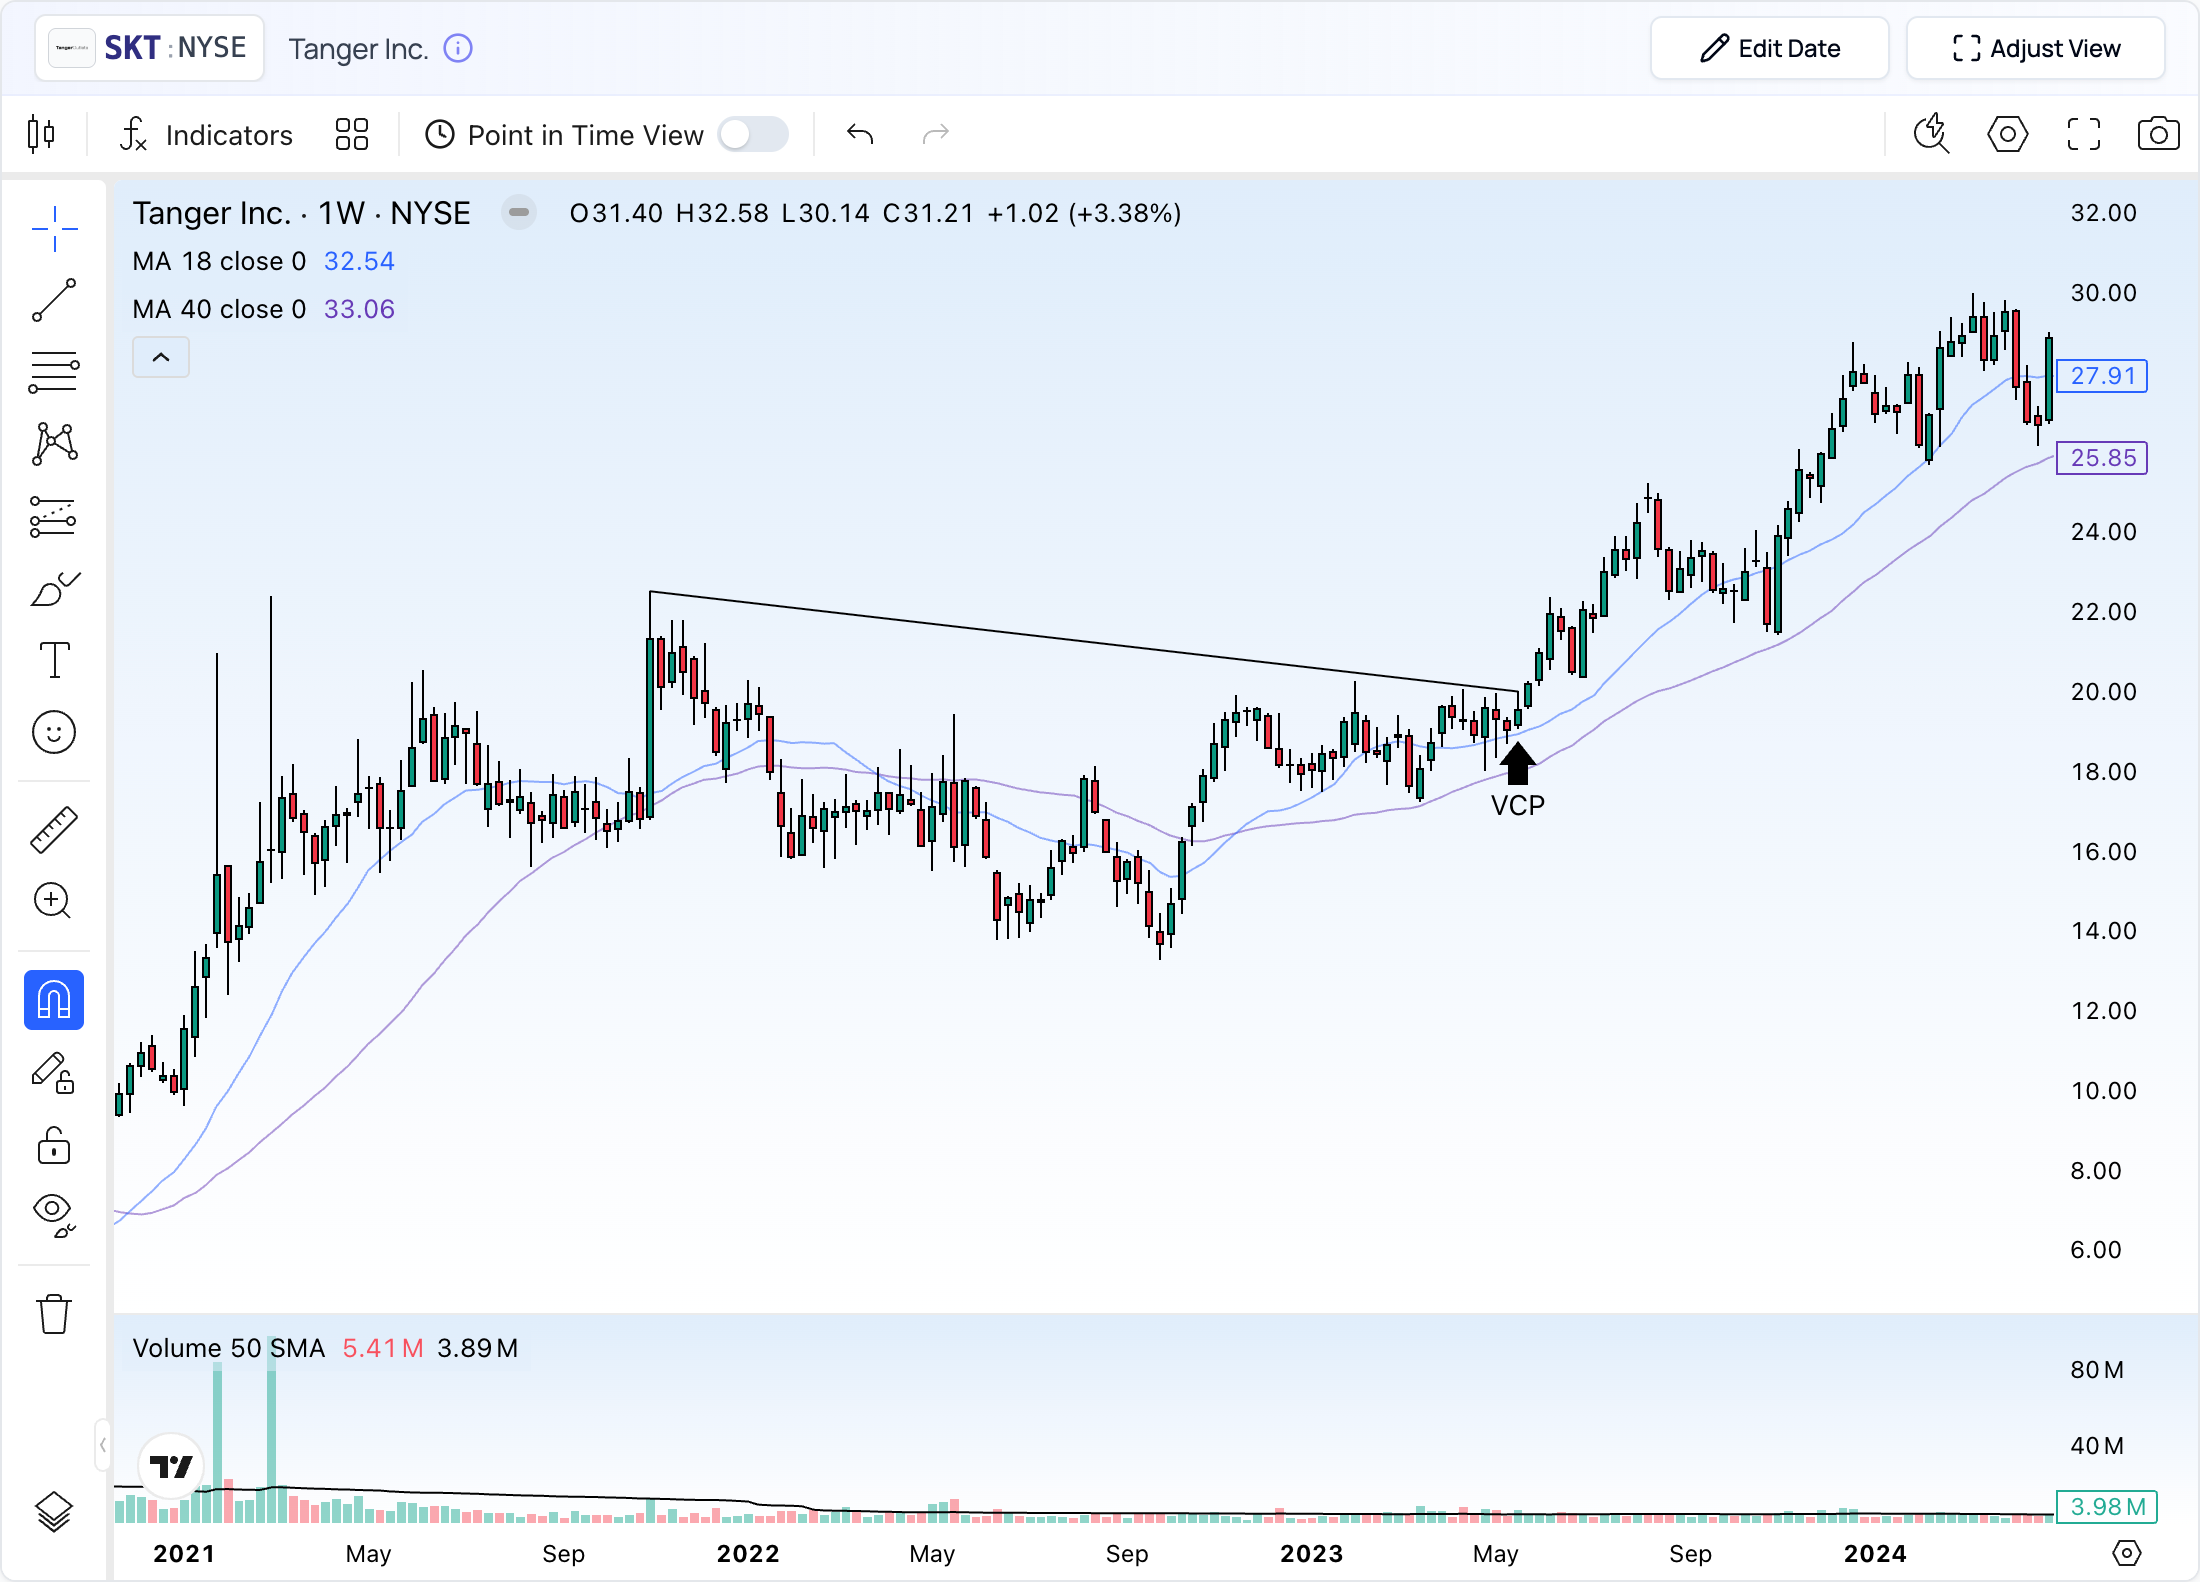
Without Point in Time View
You see the entire chart history, including what happened after the setup formed. This can create hindsight bias in your analysis.
Chart view without Point in Time enabled - showing full price history
With Point in Time View
The chart shows exactly what a trader would have seen at that moment in time - no future price action to distort your learning.
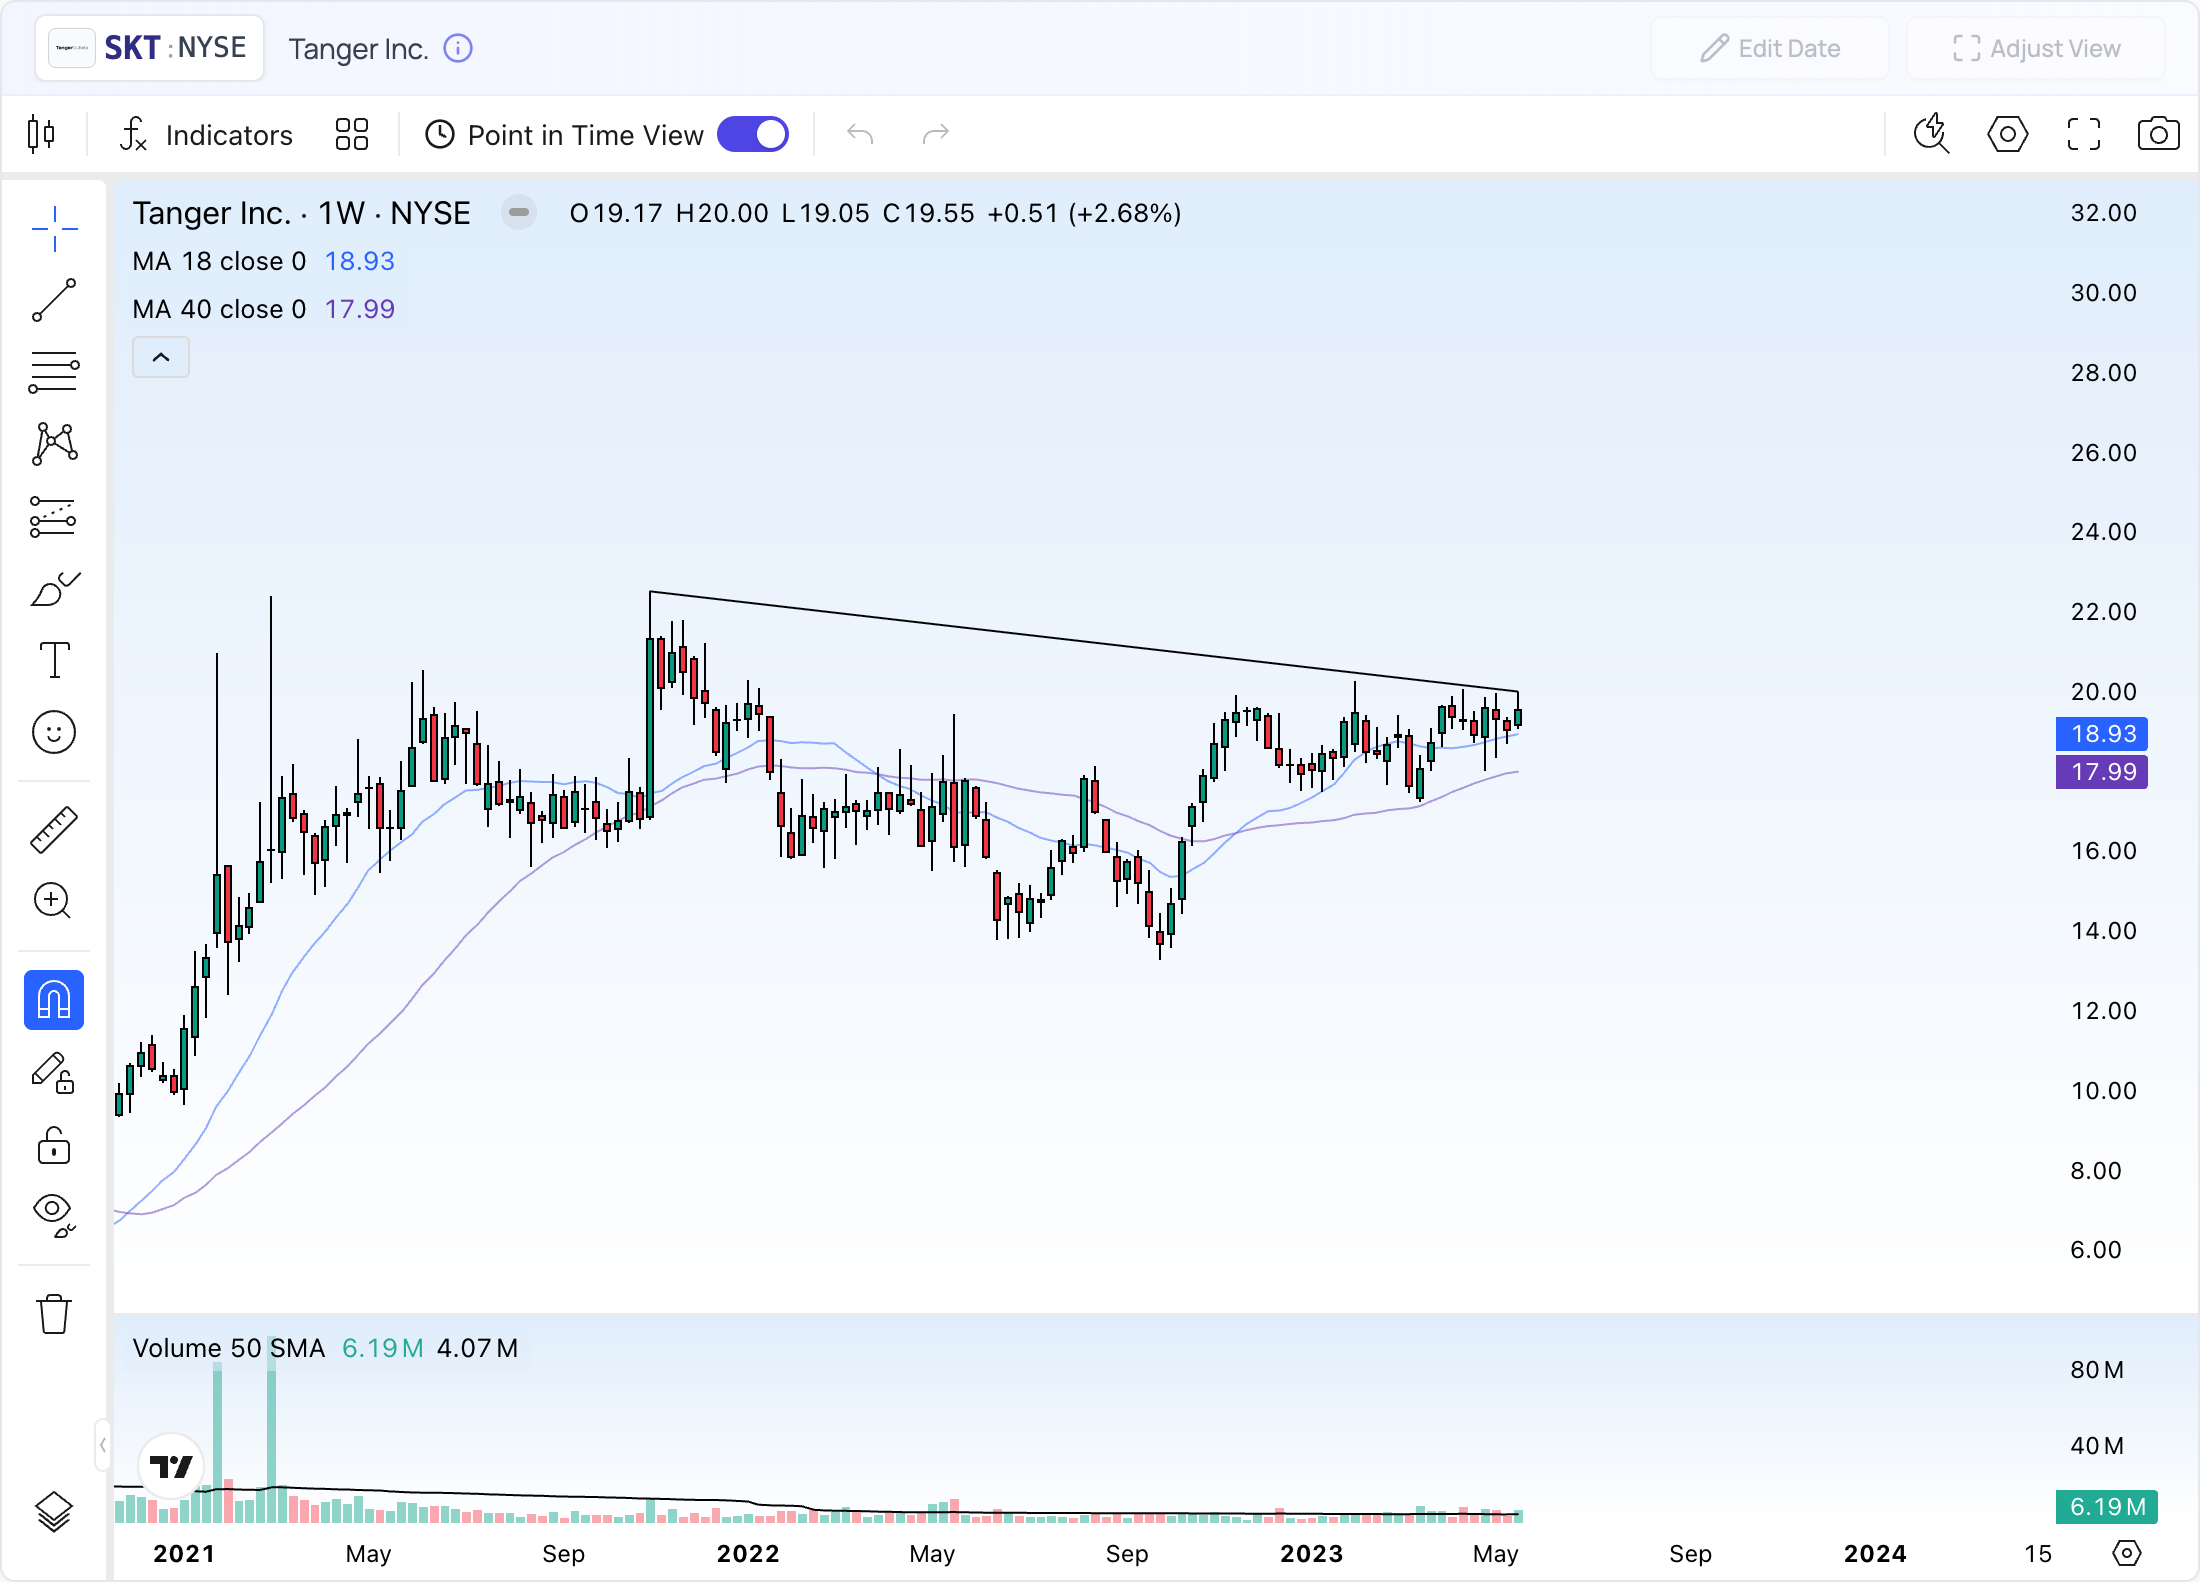
Chart view with Point in Time enabled - showing only what was visible at setup formation
Thanks to ChartLab's dynamic TradingView integration, every setup is a "living" chart. It's not locked in one moment — it's an ongoing research tool you can shape and evolve. And with our point-in-time feature, you're not just seeing history — you're stepping into it.
Inspired by the Greats
Another key inspiration for ChartLab came from William O'Neil's legendary book How to Make Money in Stocks. The very first section of the book is filled with annotated charts of top-performing stocks — a "model book" showcasing the visual patterns that preceded massive moves. O'Neil understood that traders learn best by studying historical charts to build their pattern recognition and conviction.
ChartLab carries that idea forward. But instead of flipping through static images in a book, traders can now interact with living charts — adjusting views, testing ideas, and experiencing each setup as it appeared in real time. We're making it easier than ever to build your own model book, powered by the tools we always wished we had.
Built by Traders, for Traders
This isn't some outsider tool made by a tech company guessing what traders want. ChartLab was born from the real-world needs of active traders who got tired of feeling boxed in by static workflows.
If you're serious about building your own conviction — not by following someone else's calls, but by doing the work, studying patterns, and learning to refine your edge — ChartLab was made for you.
The Bottom Line
We didn't just want to "save" setups. We wanted to breathe life into them.
ChartLab turns your research into a living, evolving edge — because great trading isn't about collecting screenshots. It's about seeing deeper, learning faster, and building real conviction.
Ready to bring your setups to life, study them at the point of discovery, and share them with the world?